Markets
Charted: U.S. Retail Investor Inflows (2014–2023)
Charted: U.S. Retail Investor Inflows (2014–2023)
U.S. retail investor sentiment hit a record breaking high at the start of 2023, buoyed by the sudden progress in AI capabilities.
Seen as a side show in the stock market for much of the last decade, retail investors are now an investing juggernaut to be considered with.
But how did they get there?
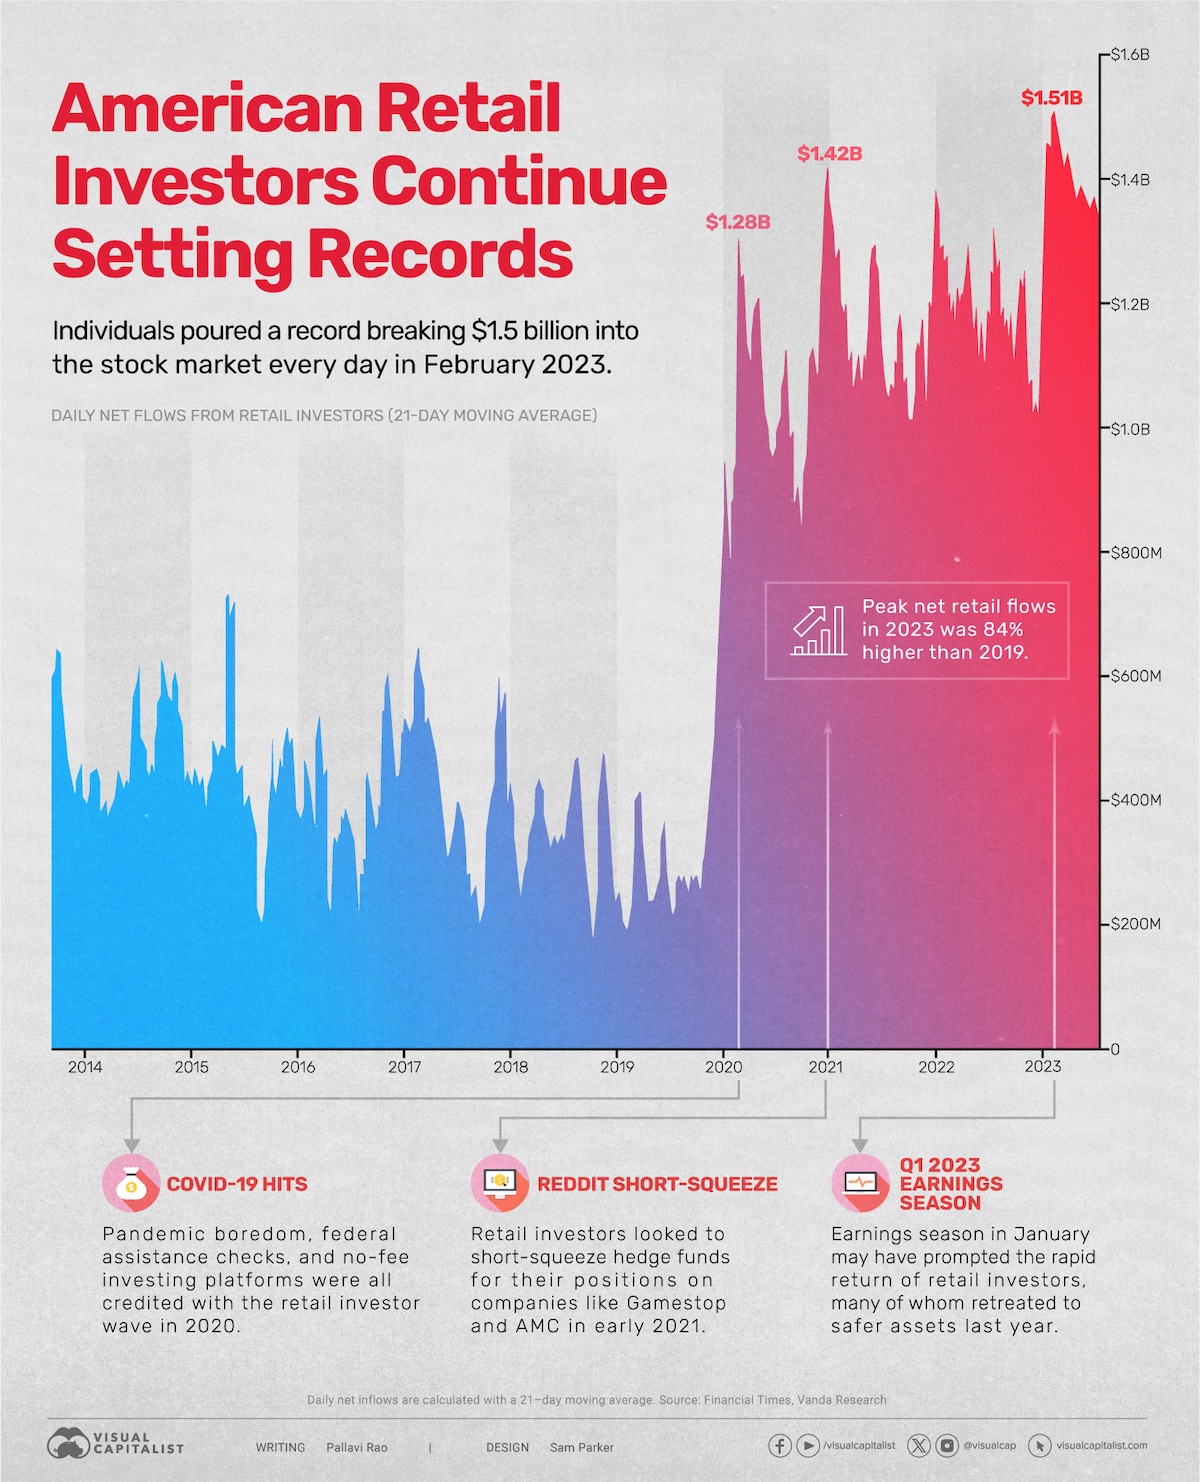
We look at data from Vanda Research, which tracks the daily net flows from U.S. retail investors (calculated using a 21-day moving average) between 2014 and 2023, visualized in the chart above.
Net Inflows from U.S. Retail Investors Break Records
Between 2014–2019, daily U.S. retail investor flows stayed range-bound, occasionally dipping below $200 million and peaking at around $700 million in 2015.
However, a series of factors propelled retail investors to new heights at the end of 2019.
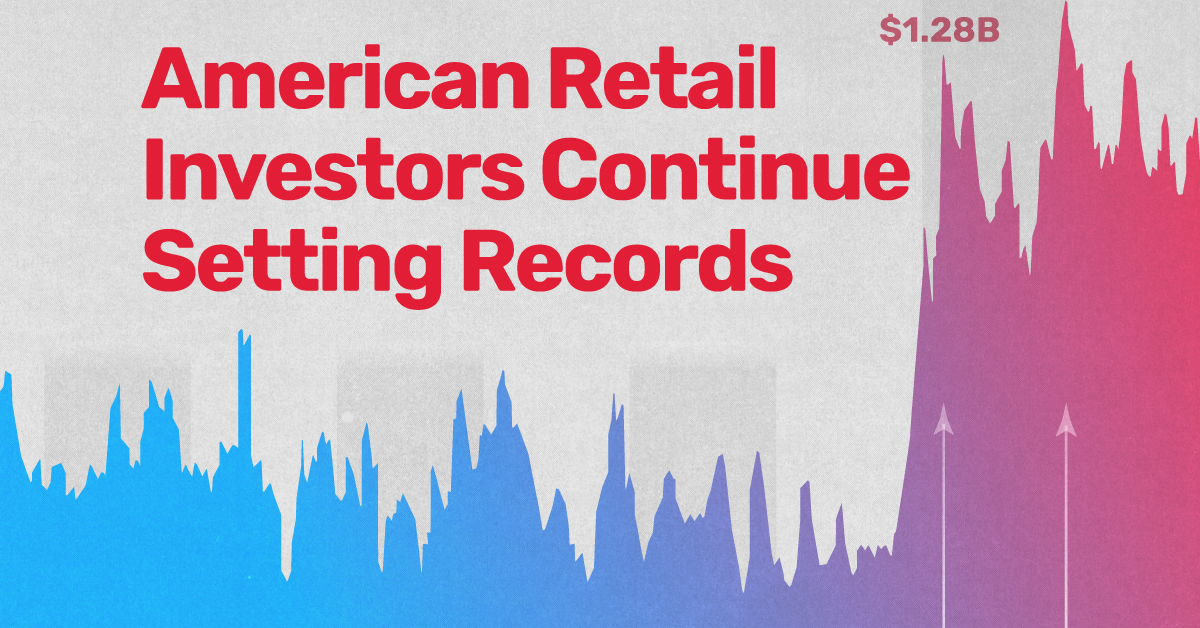
No-fee investing platforms, along with pandemic-induced boredom from lockdowns, combined with federal assistance checks sent investors scurrying to the markets. By the first quarter of 2020, daily net flows hit $1.28 billion, nearly double the previous high in 2015.
| Year | Peak Daily Retail Flows |
|---|---|
| 2014 | $620M |
| 2015 | $730M |
| 2016 | $605M |
| 2017 | $640M |
| 2018 | $480M |
| 2019 | $820M |
| 2020 | $1.28B |
| 2021 | $1.42B |
| 2022 | $1.32B |
| 2023 | $1.51B |
Sentiment—and flows—trended downwards for the rest of 2020, but in 2021, courtesy of the r/wallstreetbets inspired hedge fund short-squeeze, daily flows hit $1.48 billion, as investors piled into video game retailer GameStop.
For the next two years flows stayed locked between $1-1.4 billion per day, as inflation reared its head and bond yields began to climb.
However, in the first few months of 2023, coinciding with Q1 earnings season, U.S. retail investors came roaring back, this time shattering yet another milestone, with daily net flows crossing $1.5 billion a day in February—yet another all-time high.
And instead of going for battered-down childhood nostalgia companies, this time the retail army snapped up several tech picks, like Apple, Amazon and Nvidia, as well as dividend-paying Coca-Cola and AT&T.
Are U.S. Retail Investors Here to Stay?
Part of what is sending retail investor flows up on average is how many more Americans have been involved in the stock market in the last four years.
After the 2008 recession, American stock ownership trended downwards with about 55% investing in the market between 2009–2019.
| Time Period | Average American Stock Ownership |
|---|---|
| 1998–2008 | 61% |
| 2009–2019 | 55% |
| 2020–2023 | 58% |
Source: Gallup poll.
This was less than both the previous decade (61%) and the beginning of the new decade, (58%).
And while a fair amount of younger investors came aboard the coordinated short-squeeze effort in 2021, many have stayed invested, diversifying their portfolios and aiming for long-term gains.
Where Does This Data Come From?
Sources: Vanda Research’s insights, published in the Financial Times and Gallup’s survey on American stock ownership.
Note: In the Gallup poll, surveyors were asked: “Do you, personally, or jointly with a spouse, have any money invested in the stock market right now—either in an individual stock, a stock mutual fund, or in a self-directed 401(k) or IRA?”


Markets
Top 10 Countries Most in Debt to the IMF
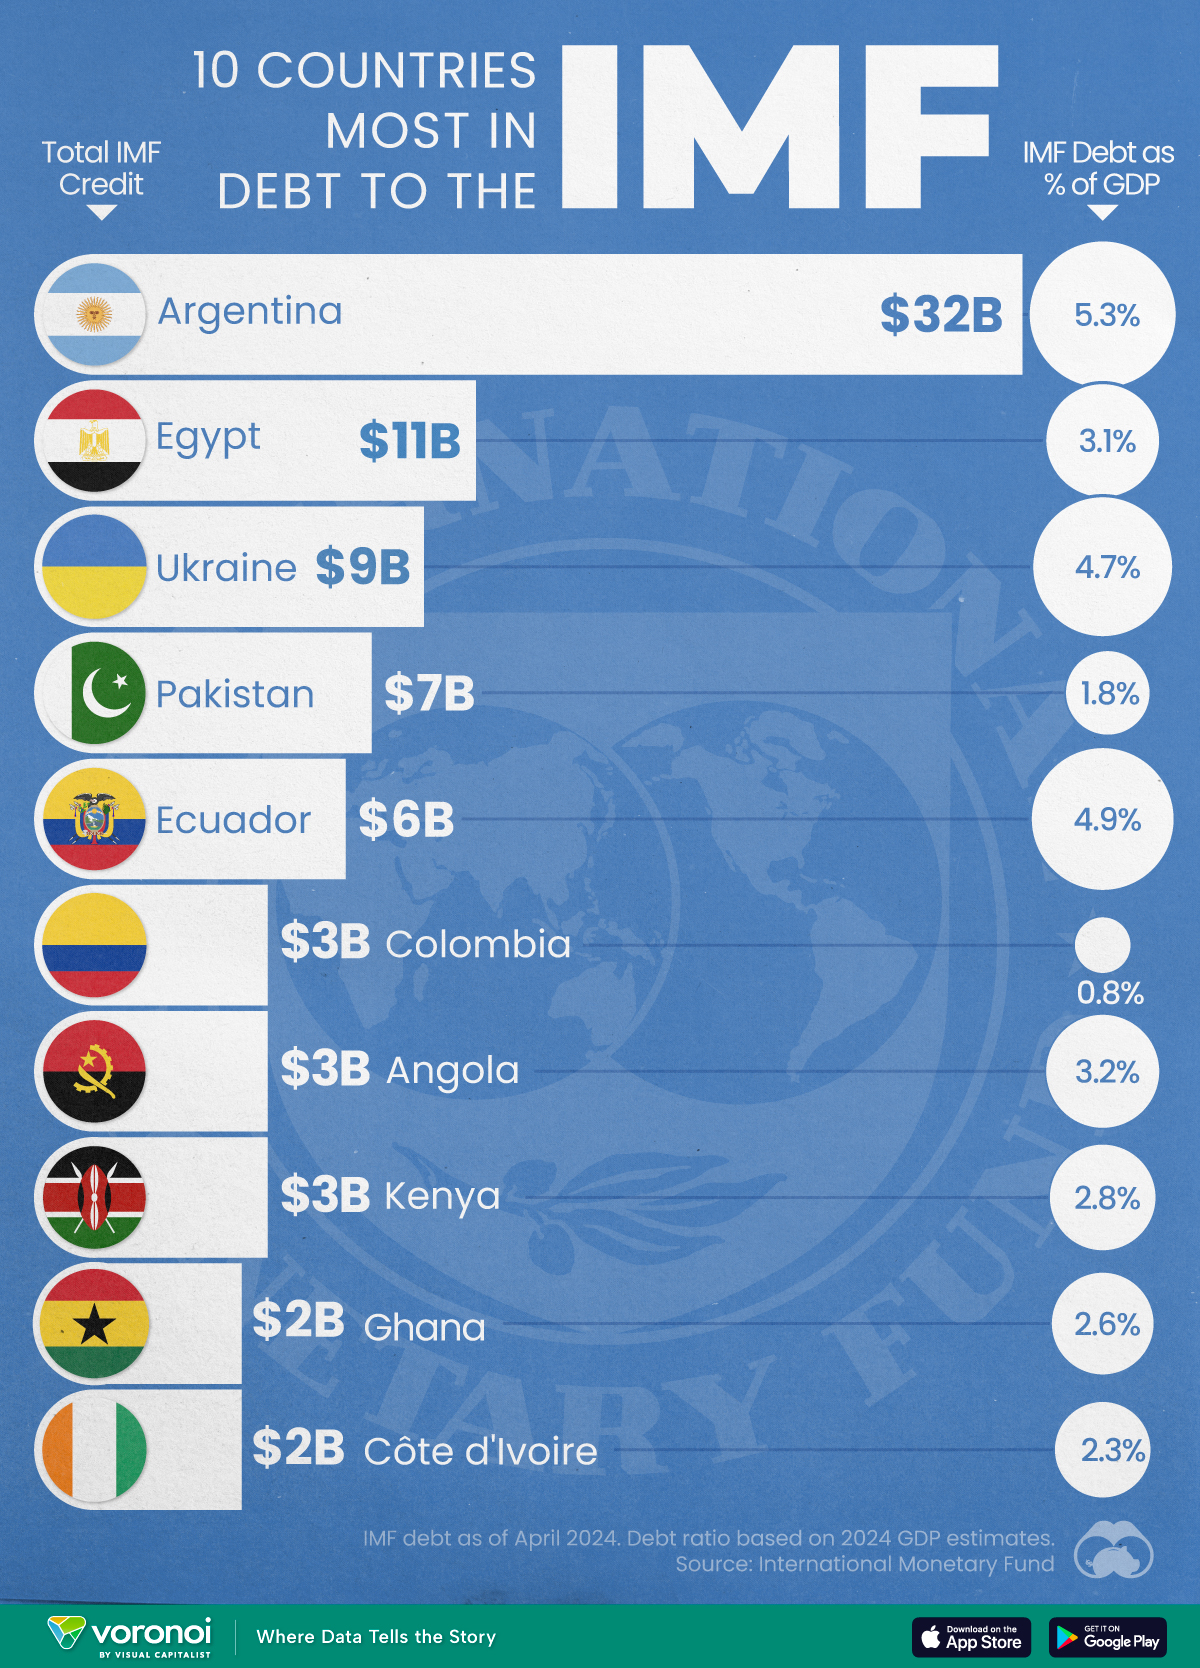
Argentina tops the ranking, with a debt equivalent to 5.3% of the country’s GDP.
Top 10 Countries Most in Debt to the IMF
This was originally posted on our Voronoi app. Download the app for free on iOS or Android and discover incredible data-driven charts from a variety of trusted sources.
Established in 1944, the International Monetary Fund (IMF) supports countries’ economic growth by providing financial aid and guidance on policies to enhance stability, productivity, and job opportunities.
Countries seek loans from the IMF to address economic crises, stabilize their currencies, implement structural reforms, and alleviate balance of payments difficulties.
In this graphic, we visualize the 10 countries most indebted to the fund.
Methodology
We compiled this ranking using the International Monetary Fund’s data on Total IMF Credit Outstanding. We selected the latest debt data for each country, accurate as of April 29, 2024.
Argentina Tops the Rank
Argentina’s debt to the IMF is equivalent to 5.3% of the country’s GDP. In total, the country owns more than $32 billion.
| Country | IMF Credit Outstanding ($B) | GDP ($B, 2024) | IMF Debt as % of GDP |
|---|---|---|---|
| 🇦🇷 Argentina | 32 | 604.3 | 5.3 |
| 🇪🇬 Egypt | 11 | 347.6 | 3.1 |
| 🇺🇦 Ukraine | 9 | 188.9 | 4.7 |
| 🇵🇰 Pakistan | 7 | 374.7 | 1.8 |
| 🇪🇨 Ecuador | 6 | 121.6 | 4.9 |
| 🇨🇴 Colombia | 3 | 386.1 | 0.8 |
| 🇦🇴 Angola | 3 | 92.1 | 3.2 |
| 🇰🇪 Kenya | 3 | 104.0 | 2.8 |
| 🇬🇭 Ghana | 2 | 75.2 | 2.6 |
| 🇨🇮 Ivory Coast | 2 | 86.9 | 2.3 |
A G20 member and major grain exporter, the country’s history of debt trouble dates back to the late 1890s when it defaulted after contracting debts to modernize the capital, Buenos Aires. It has already been bailed out over 20 times in the last six decades by the IMF.
Five of the 10 most indebted countries are in Africa, while three are in South America.
The only European country on our list, Ukraine has relied on international support amidst the conflict with Russia. It is estimated that Russia’s full-scale invasion of the country caused the loss of a third of the country’s economy. The country owes $9 billion to the IMF.
In total, almost 100 countries owe money to the IMF, and the grand total of all of these debts is $111 billion. The above countries (top 10) account for about 69% of these debts.

-

 Maps7 days ago
Mapped: Southeast Asia’s GDP Per Capita, by Country
-

 Markets2 weeks ago
Visualizing Global Inflation Forecasts (2024-2026)
-

 United States2 weeks ago
Charted: What Southeast Asia Thinks About China & the U.S.
-

 United States2 weeks ago
The Evolution of U.S. Beer Logos
-

 Healthcare1 week ago
What Causes Preventable Child Deaths?
-

 Energy1 week ago
Who’s Building the Most Solar Energy?
-

 Markets1 week ago
Mapped: The Most Valuable Company in Each Southeast Asian Country
-

 Technology1 week ago
Mapped: The Number of AI Startups By Country