
CFD simulations validate pharma company’s HVAC CapEx investment
Deep in California’s San Fernando Valley, where temperatures can exceed 100F in the summer and fall to the single digits in winter, Takeda has a 55,000-square-foot warehouse that stores extremely temperature-sensitive raw materials and finished plasma products.
This global pharmaceutical company relies on a legacy HVAC system to maintain internal temperatures. Now in its third decade of operation, this system is critical to product quality; if temperatures breach the hard limits specified in the warehouse’s validated design, Takeda’s products would rapidly deteriorate. To prevent this and extend the life of its warehouse, Takeda asked CRB to overhaul the HVAC system with an all-new, state-of-the-art design, using the latest in efficient technologies to reduce the energy load and better control the warehouse environment.
Project Details
Client
Takeda
Location
San Fernando Valley, CA
Square Footage
55,000
The challenge:
Upgrading Takeda’s HVAC system meant replacing more than twenty rooftop units (RTUs), along with all the associated ductwork, diffusers and fans.
To justify the significant capital costs required for an upgrade of this scale, Takeda had to know—with as much certainty as possible—that the investment would pay off. And our team of engineers needed to deliver a new HVAC system capable of maintaining an extremely narrow temperature range inside the warehouse—between 20C and 23C.
California’s extreme climate was just one variable in this dynamic puzzle. To design a system that would meet Takeda’s requirements, we needed to consider the impacts of multiple boundary conditions inside the warehouse, including:
The battery charging rooms and stability lab: The equipment in these areas, adjacent to warehouse racks holding sensitive materials, create significant heat loads. Our new design needed to contain and exfiltrate this heat, preventing it from impacting the stored products.
The roof: The warehouse roof slopes from 40 feet high at its center to less than 35 feet at either end of the building. This design could create pockets of stagnation along the roofline. To prevent this, our design needed to create consistent and effective airflow throughout the building.
The loading docks: As refrigerated trucks come and go from the warehouse, an imperfect seal could impact internal temperatures through exfiltration of internal airflow. Our design had to account for and mitigate against this risk.
The warehouse racks: Warehouse shelves sit as low as 6 inches above the ground and reach up to 22 feet high. Products stored on those low shelves could be impacted by cold ground temperatures during winter; higher up, products could be impacted by heat coming through the roof in summer. We needed to account for these variables in our design to prevent temperature stratification.
Operators and reach trucks: These variables also contribute to potential temperature fluctuations within the warehouse. To account for them, we included 15 people and 3 reach trucks in all our design simulations.
With these factors in mind, our objective was to design an HVAC system that would ensure:
- Effective and consistent airflow throughout the building
- Temperature stability within the target range in product storage areas
- Uniform temperature distribution
The process: designing and validating an HVAC system
1. Our mechanical engineers developed a completely new HVAC design
CRB’s mechanical engineering team designed a new HVAC system for the warehouse, featuring:
- Sixteen RTUs—By leveraging the latest in energy-efficient technologies and by introducing a new type of ceiling fan known as the “pear drop,” our design team was able to reduce Takeda’s HVAC equipment from more than 20 RTUs to just 16.
- Multiple diffusers per RTU—Our design team strategically located and oriented these diffusers to promote good air distribution.
- Eighty-nine pear drop ceiling fans—This fan performs better than Takeda’s legacy fans, and our engineering team’s proposed layout includes more of them to better eliminate stagnant zones within the warehouse.
2. We validated the HVAC design with computational fluid dynamics (CFD) simulations
As CFD engineers, our goal is to make sure that a proposed design will work the way it’s intended to, using computer simulations to model that design’s behavior before our clients invest in real-world implementations.
In this case, we focused our CFD study on two variables: airflow and temperature. How would one of those variables impact the other inside the warehouse? How could we optimize our design to better control each one? How would seasonal shifts in temperature impact the warehouse’s environment? Each simulation brought us closer to the answer.
We started by building a computational domain of the 55,000-square-foot warehouse. This domain needed to be detailed enough to run accurate CFD simulations, but not so detailed that it inhibited rapid design iteration. To hit that mark, we simplified the warehouse geometry inside our model by removing all unimportant objects and surfaces (such as door frames and bollards) and by modeling warehouse racks as impervious rectangular blocks (Figure 1).

Figure 1. CFD computational domain
- 55,000 ft2
- 16 RTUs, 4 diffusers/RTU
- 89 Pear Drop Fans
- 15 people and 3 reach trucks
- Exhaust: Stability lab, battery charging rooms
- 2” air gap in loading dock #10
This approach accelerated the simulation process, and it made our CFD model more conservative, particularly in terms of airflow. In other words, if the proposed design succeeded in our model, which was divided by solid rectangular blocks, then it was certain to succeed in the real environment, with its open warehouse racks promoting even better airflow.

Figure 2. Volume mesh CFD computational domain
After building the computational domain, we discretized it into small, interrelated cells, collectively known as the volume mesh (Figure 2). These cells feed our CFD calculations. The smaller they are, the more detail they yield. That’s why you see increased granularity along the model’s inflation layers, where a solid boundary (such as a wall, a person or a ceiling fan) affects airflow. To understand the impact of these inflation layers, we needed to observe them at a high resolution.
How our CFD and mechanical engineering teams worked together
Using our computation domain and the volume mesh, we worked with our mechanical engineers to test their proposed design, revise it, and test it again.
We repeated this cycle twice, which brought us to a fully optimized, predictable solution for Takeda. The design revisions that got us there involved relatively simple questions whose answers had an enormous impact on the temperature field in the warehouse, such as:
- What if we adjust the direction of a diffuser?
- What if we add, remove, or relocate a pear drop fan?
- What if we manually adjust the temperature output of a specific RTU?
Furthermore, we needed to examine how the answers to these and other critical questions might change throughout the year—after all, the RTUs would have a very different job to do during a California heat wave than they would in the more temperate months. To understand that dynamic, we modeled our proposed design at peak summer and peak winter, testing and tweaking its numerous variables until we found the right calibration to maintain average temperatures within the target range (Figure 3).
Figure 3. Average temperature target range
3. Next, we used CFD simulation visualizations to qualitatively validate that design with our client
Once our collaboration with the mechanical engineering team yielded a complete and optimized design, we shared those results with Takeda. But showing our client a set of temperature averages would not be enough—in our experience, problematic areas can sometimes hide inside the bigger picture. To find them, we needed to dig deeper.
We looked closely at airflow dynamics
First, we used a series of visualizations to demonstrate the impact of our diffusers and pear drop fans on air velocity throughout the warehouse. These visuals allow us to qualitatively inspect all areas of potential concern and identify potential stagnation of air and/or recirculation which are generally not conducive to good heat transfer. As you can see, the velocity planes (Figure 4) show good air movement between the warehouse racks. The “dead zones” at the east and west extremities represent the stability lab and battery charging rooms, where product quality is not at stake.


Figure 4. Air velocities CFD simulation
Another view (Figure 5) shows the direction of airflow through the facility, while a third (Figure 6) captures air velocity as individual plotlines throughout the warehouse.

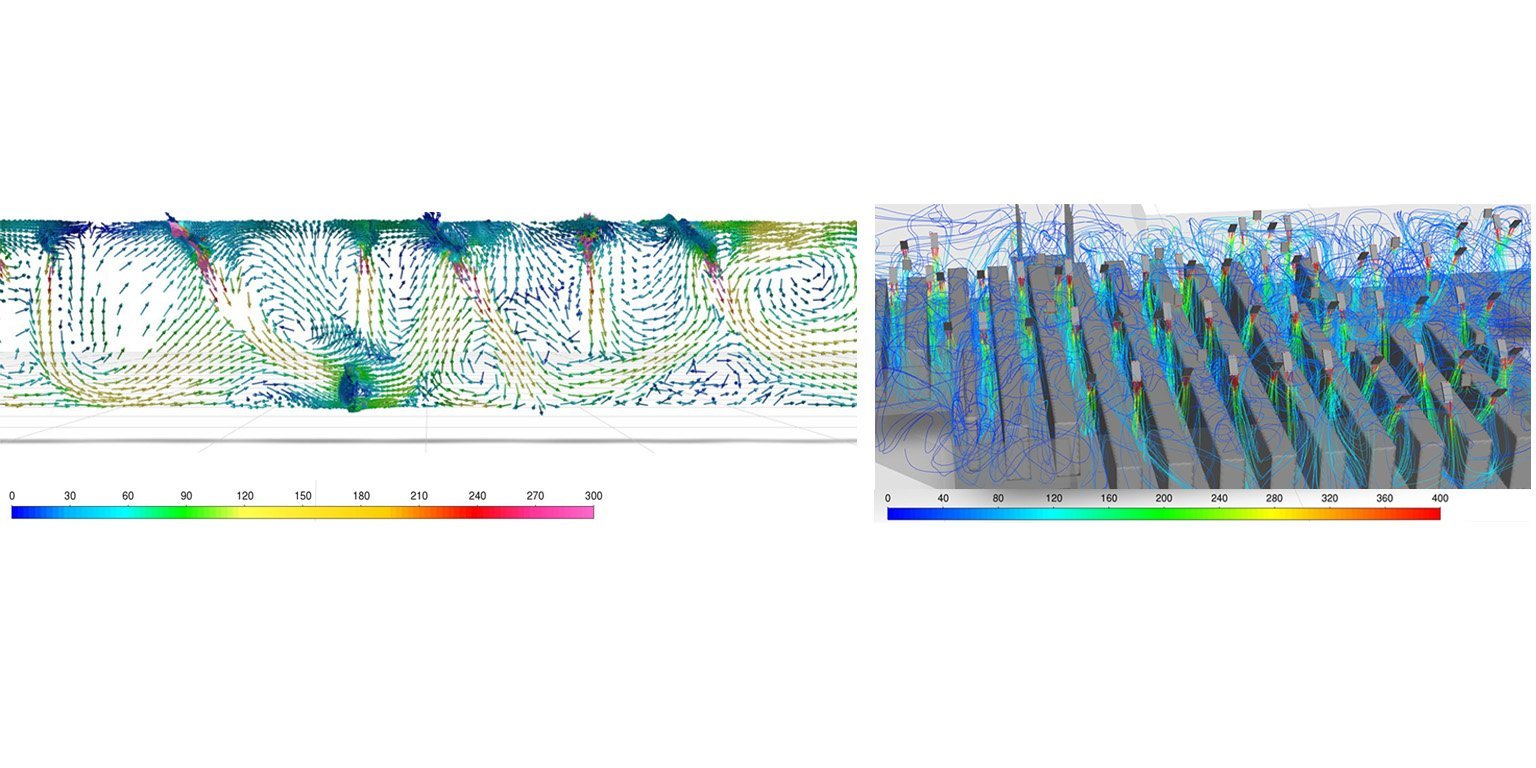
Figure 5. Air velocities CFD simulation
Figure 6. Air velocities CFD simulation
Each of these visuals gave our team and the client another angle from which to assess airflow, adding new layers of information to a composite picture of this system’s performance.
We assessed temperature stability across the warehouse racks
Our next task was to demonstrate, in detail, the impact of the new design on temperature distribution between the racks under both summer and winter conditions (Figure 7).
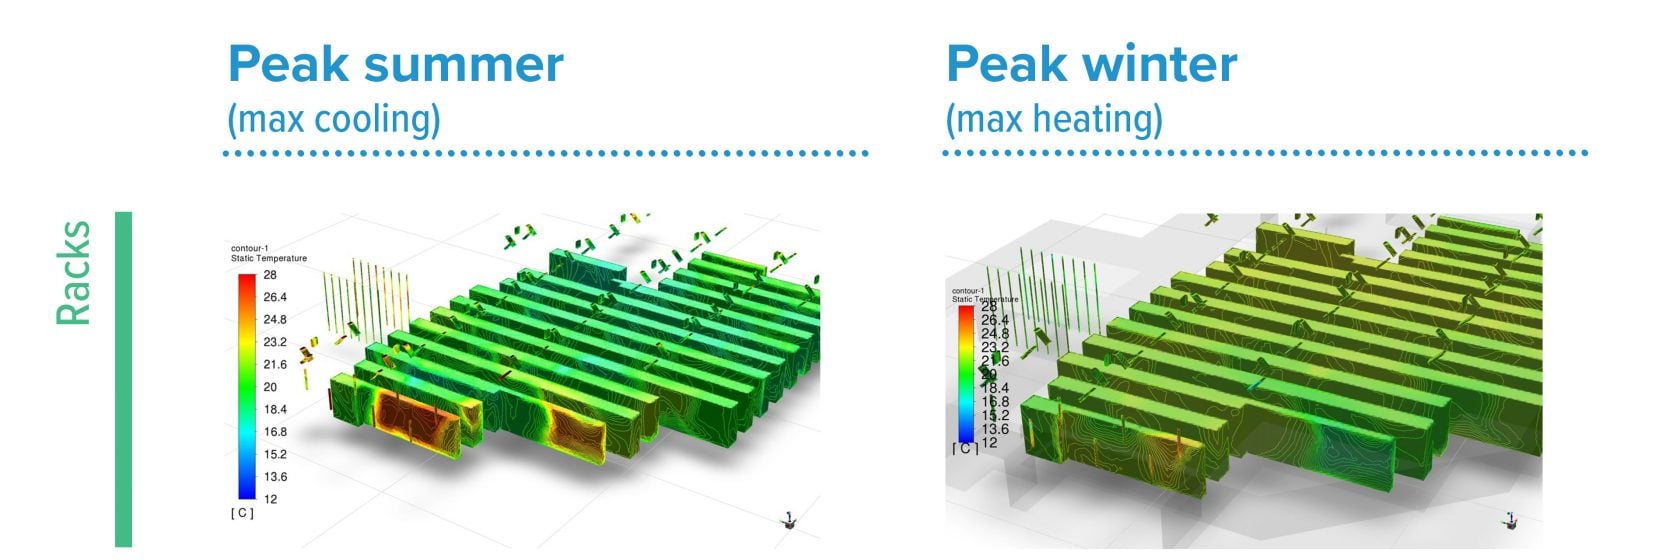

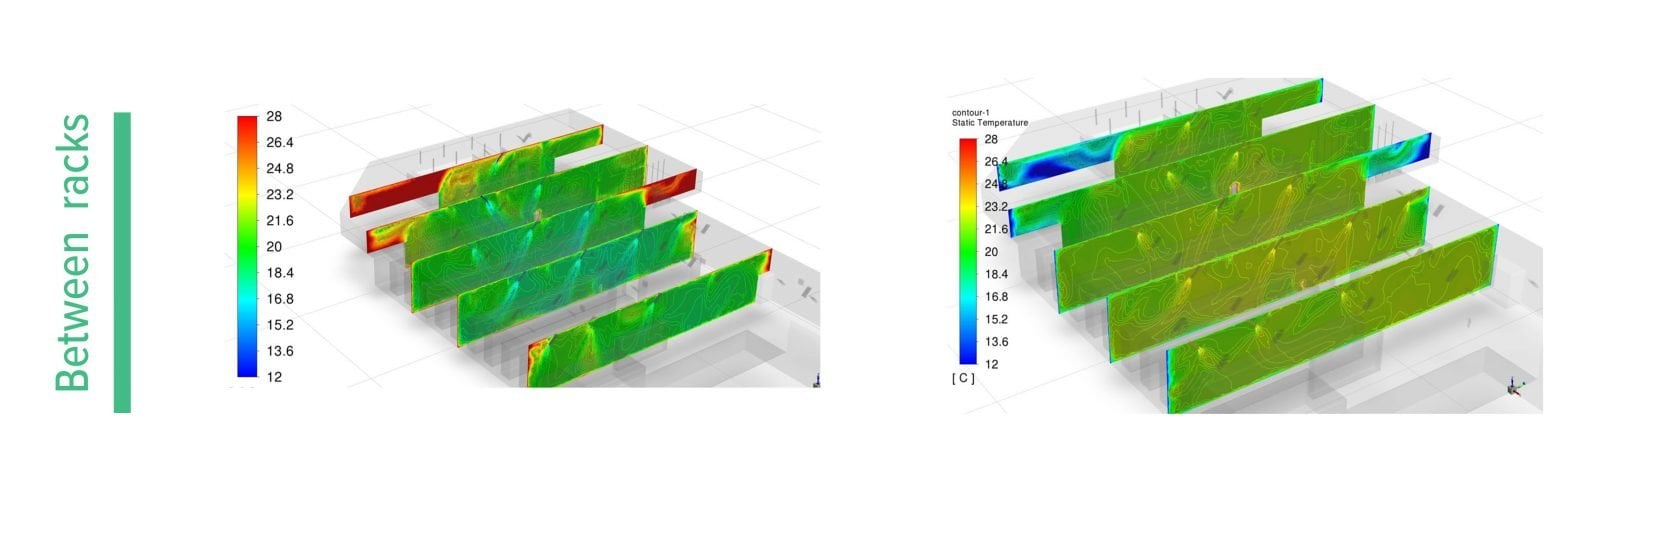
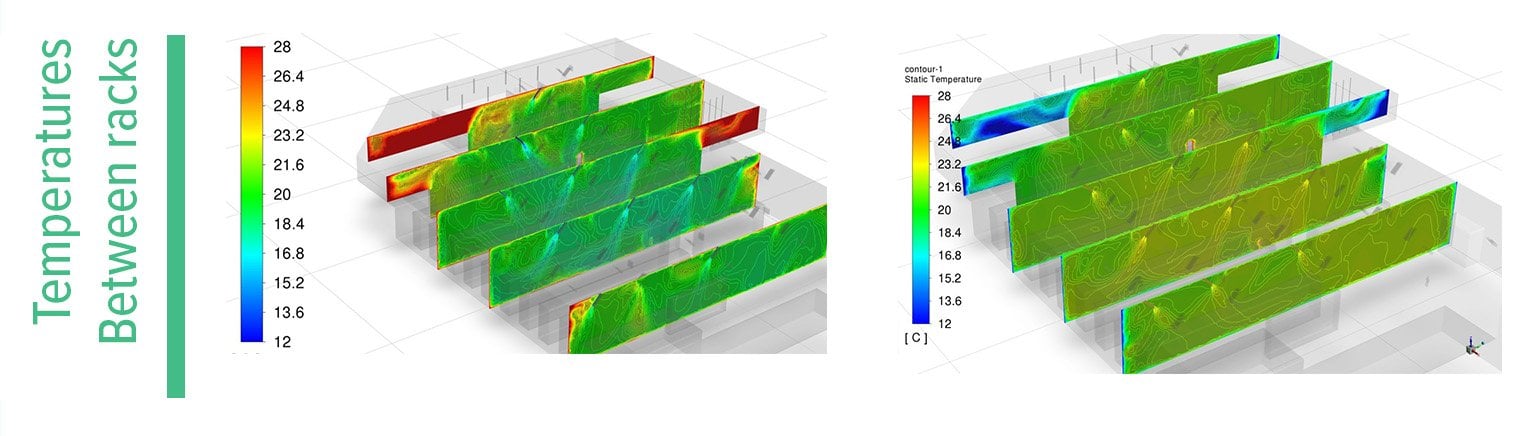
Figure 7. Temperature stability CFD simulations
Again, our focus was on the critical areas of the warehouse, where sensitive products were stored. That’s why the red zones observed in the summer simulation are not a cause for concern. As you can see, our design successfully contains those heat loads, ensuring that the sensitive materials stored on warehouse racks are not impacted.
We looked for signs of uniform temperature distribution
After establishing that the overall temperature throughout the warehouse racks would fall within the target range, we intensified our scrutiny even further, this time examining the temperature plane at various heights throughout the warehouse. This was a critical step, because sensitive products could be stored as close as 6 inches to the ground, or as high as 22 feet. Any temperature stratification left undetected between these two extremes could impact product quality.
To perform this assessment, we examined cross-sections of the temperature plane, starting directly on the floor and ascending through the warehouse at intervals (Figure 8).
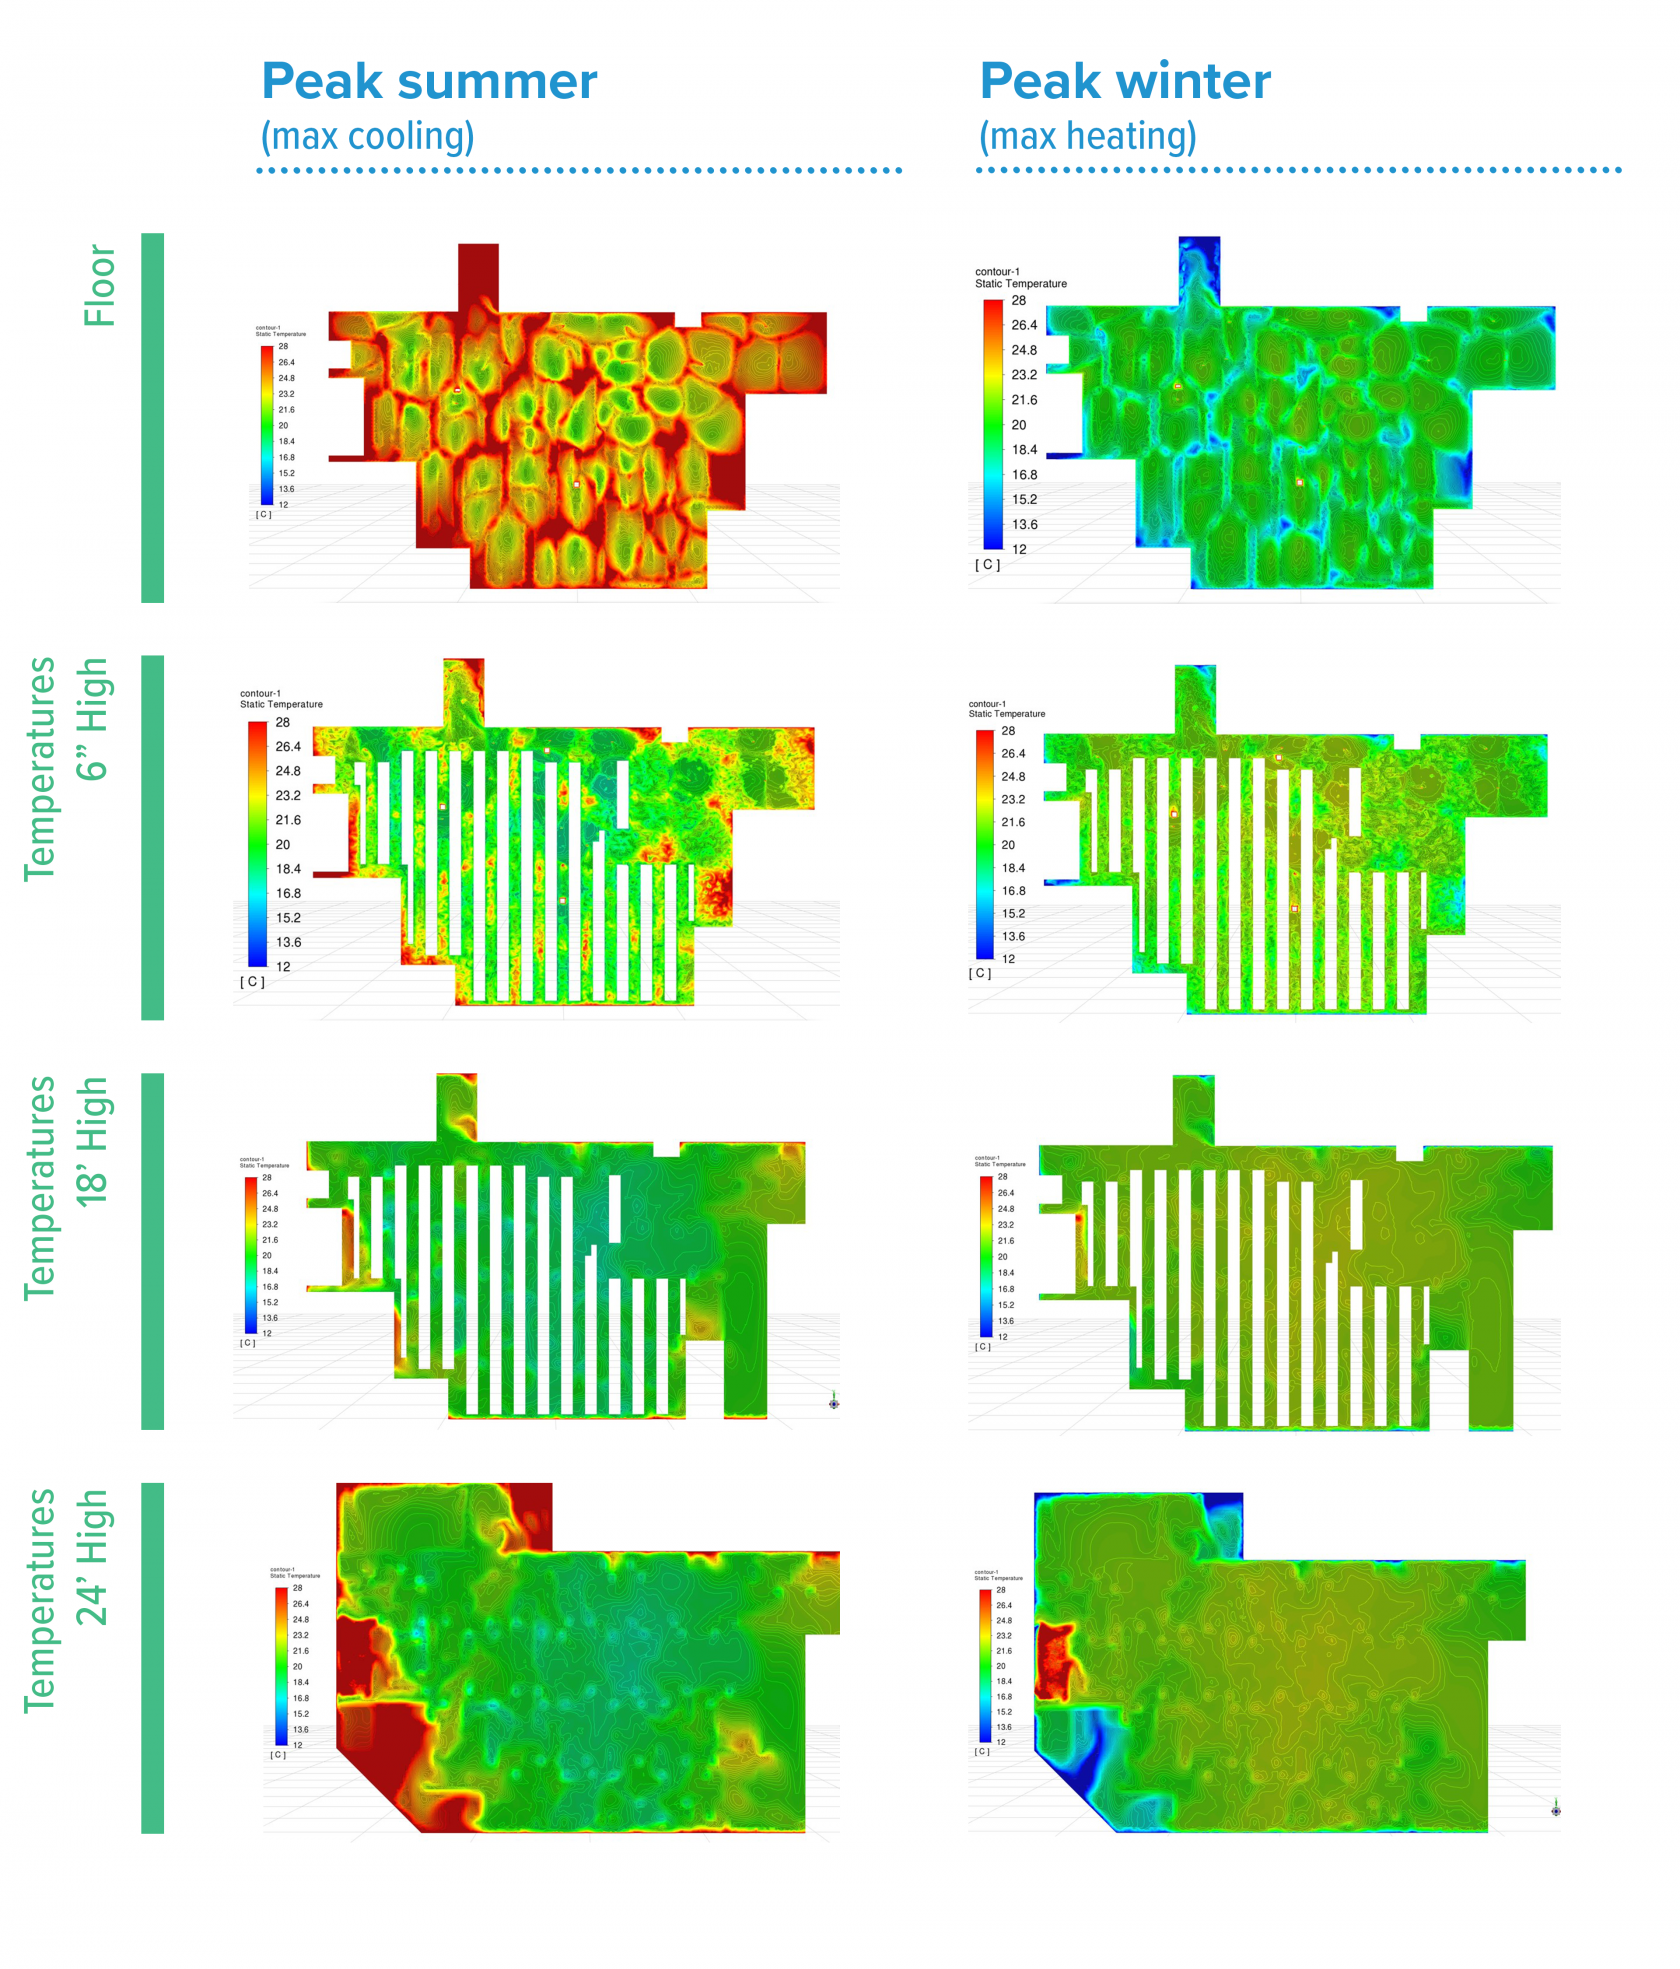

Figure 8. Temperature distribution CFD simulations
As expected, temperatures at the floor—where the building’s foundation meets the ground—were high in summer and low in winter. Takeda’s big question: Would our proposed design successfully mitigate these temperature extremes so that products on the lowest shelves would not be impacted? And was that system capable of maintaining stability at every point above that, all the way to the top of the racks? As you can see, the answer was affirmative.
We studied the impact of the loading docks on warehouse temperatures
Throughout our examination of the temperature planes, we gave special attention to the loading docks along the western wall of the warehouse. Each time a refrigerated truck docked at a warehouse door, it created an opportunity for external conditions to impact interior temperatures. Dock #10 was of particular concern, since it was closest to the critical racks. If we could understand the potential risk exposure of this loading dock, then we could ensure that our system was robust enough to mitigate it.
To reach that understanding, we included Dock #10 in our computational domain. By design, we made the gap around the loading dock larger than typically observed in the actual warehouse—we wanted to be certain that our system would maintain temperature stability among the warehouse racks even under the most demanding conditions.
As you can see in Figure 9, neither summer nor winter temperatures outside of the warehouse penetrated the temperature fields surrounding the warehouse racks, even with such a significant gap at the loading dock.
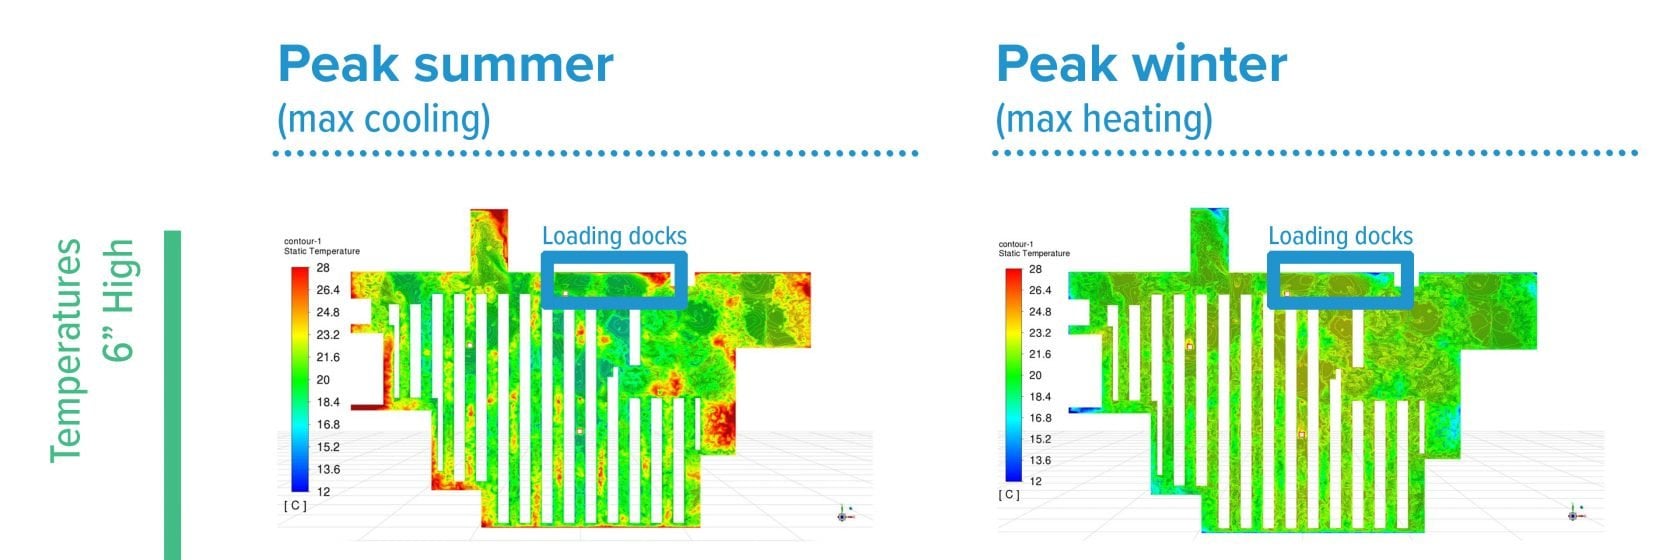
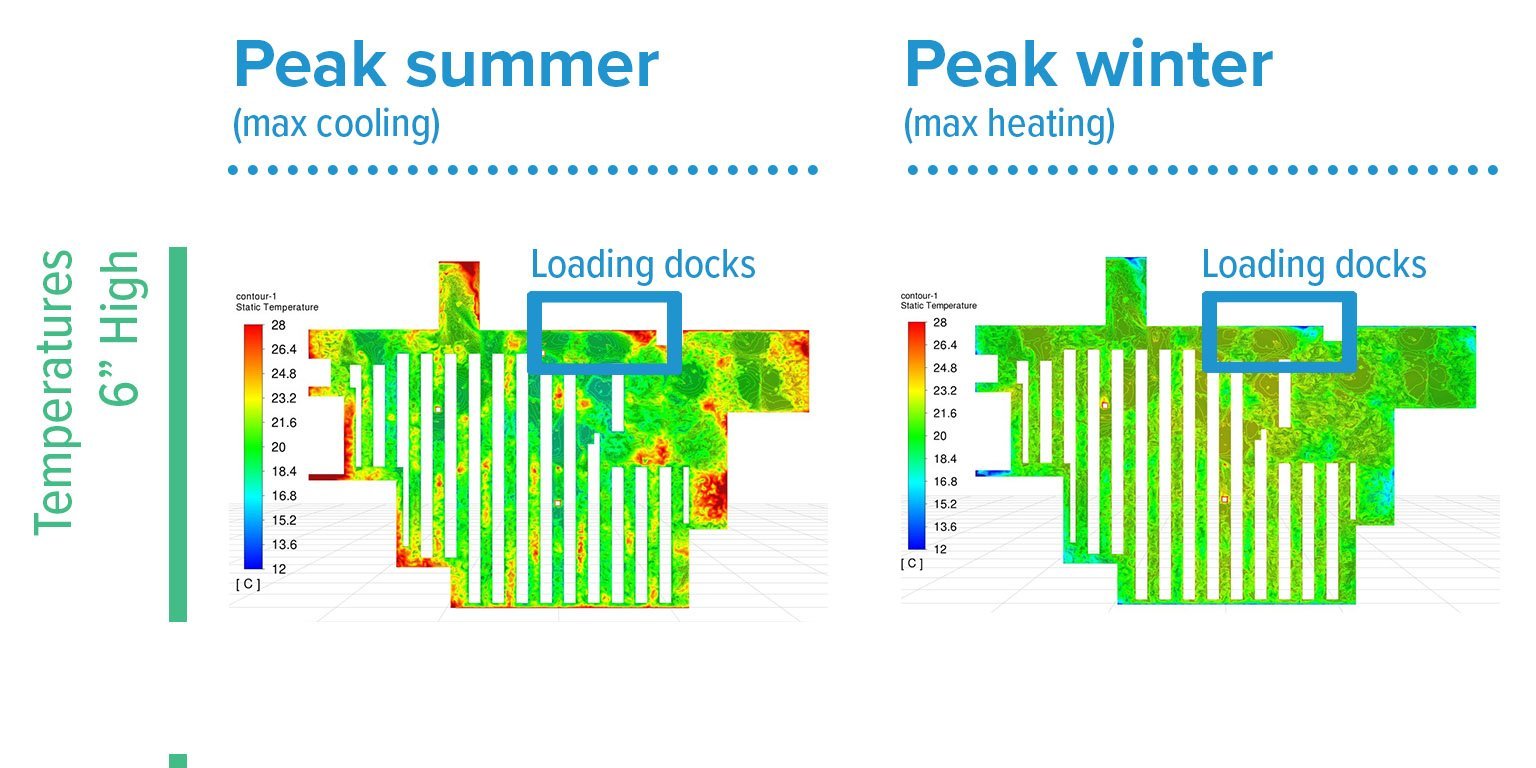
Figure 9. Warehouse temperature field CFD simulations
When our client’s equipment vendor proposed a different design, we helped Takeda evaluate that proposal
After reviewing our CFD simulations, Takeda took the next step: they submitted our design to their equipment manufacturer for a cost and scheduling estimate.
The equipment vendor responded with a curveball by offering an alternative design that claimed to save Takeda $100,000 in materials and labor costs.
Takeda was cautious. The vendor’s alternative design, which simplified CRB’s proposed ducting system and relocated several diffusers, resembled Takeda’s legacy HVAC system—the system that they had set out to replace. Reducing their capital expenditure was an attractive option, but not at the expense of product quality. Takeda needed to understand how the vendor’s alternative design would perform before approving it.
To reach that understanding, our client brought the vendor’s alternative design to our CFD team. We modeled that design and ran it through the same robust CFD simulations that we’d used to validate our own design (Figure 10).

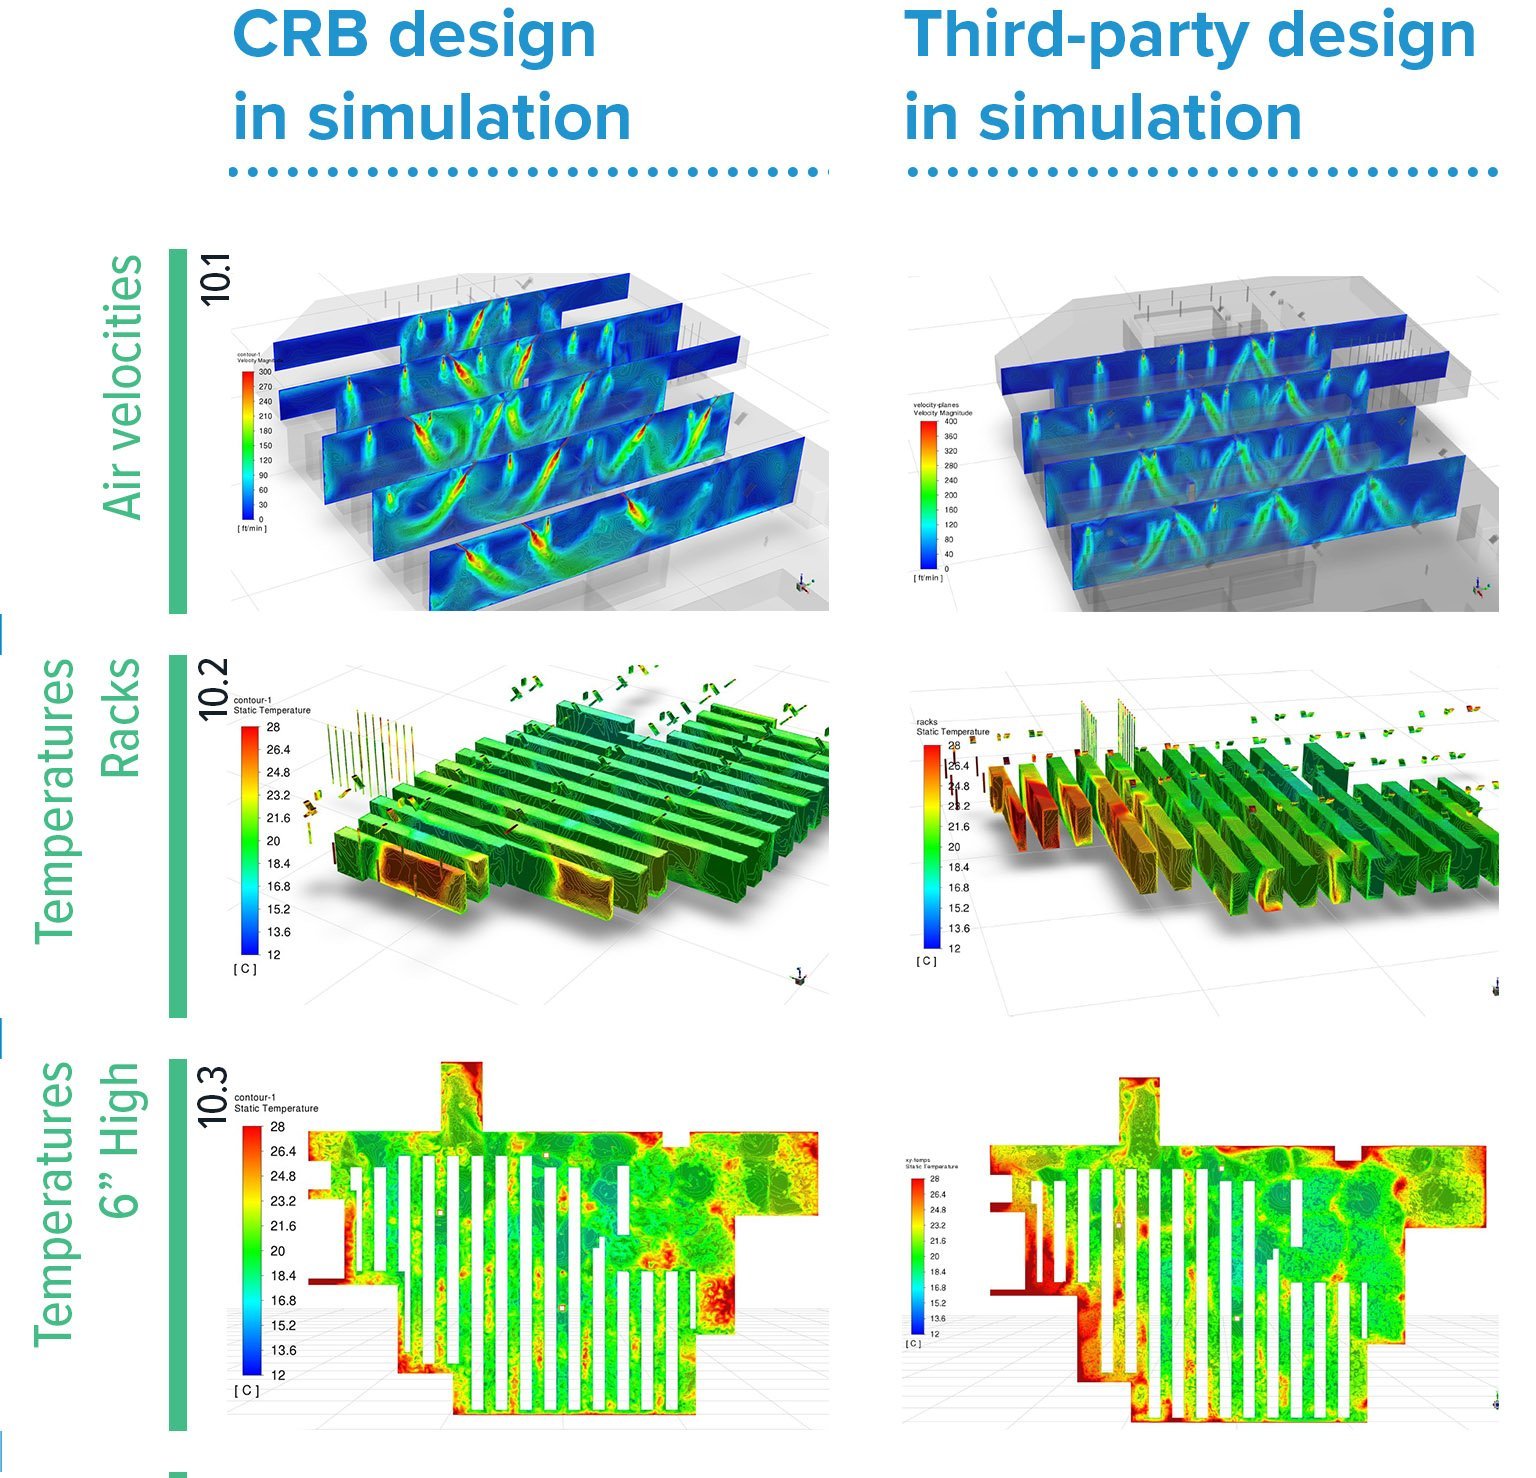
Figure 10. CFD simulation design comparison
These CFD simulations revealed that air velocity dropped in the alternative design (10.1), and that heat loads coming from the stability lab and battery charging rooms penetrated much further into the warehouse racks (10.2). We also noted a greater risk of temperature excursions near the bottom of the racks at peak summer (10.3).
The result: CFD evaluations provided decision-making confidence
By simulating airflow dynamics and temperature distribution inside the warehouse, we were able to show Takeda that:
- CRB’s proposed design would reliably maintain warehouse temperatures within the target range.
- The equipment vendor’s alternative design introduced a significant risk of temperature excursions.
With the due diligence of our CFD consultants to guide them, Takeda knew that the higher upfront cost associated with CRB’s original design was more than offset by what that design offered: the certainty that its warehouse would remain a consistent and closely controlled environment, capable of protecting our client’s most sensitive plasma products from temperature excursions.
Key Takeaways:
- CFD simulation is more than a due diligence exercise. Done properly, it’s also a design tool. There’s a reason that our proposed HVAC system performed well when we presented it to Takeda. By the time our client saw it, we had already perfected that system’s design through a collaborative effort between our CFD and mechanical engineering teams. That’s where the real payoff of simulations comes into play. They don’t just prove that something works after it’s designed—they are part of the design, informing it from the start.
- To really understand a design, look deeper. Averages are a good overall indication of performance, but they don’t tell the full story. Our in-depth CFD simulations located any hidden areas of stagnation or temperature fluctuation within the whole so that we could address those issues at the design stage, avoiding costly surprises after real-world implementation.
- CFD simulations save money. Simulating a proposed design in a computational model will not only help to justify your capital spending and manage your economic risks, but it will also prepare you to optimize your new system from day one. For Takeda, our simulations gave them the predictive data they needed to calibrate specific RTUs to different temperature settings and to aim diffusers where necessary, saving the cost and time required for extensive on-site testing.
About the CFD experts

Riju Saini, PhD
Riju, a Fellow of Simulation, Modeling, CFD, based in the Boston office, has extensive experience helping clients globally in the chemical, petrochemical, pharmaceutical, semiconductor and allied industries. He is an expert in thermodynamics, conceptual process design, steady state and dynamic process simulation, economic analysis, process safety, consequence and risk analysis, mathematical and numerical analysis, and software development.

Chris Buchser
Chris works out of our Plymouth Meeting office as a Computational Fluid Dynamics Engineer, with a focus on finding solutions to complex and challenging technical problems that help biopharmaceutical clients reduce their costs and intensify their operations. He is known for developing complex CFD models capable of accurately predicting outcomes and supporting the analysis, design, and optimization of key engineering designs.
Get in touch with Riju and Chris.