
Drawdown Georgia is the first significant attempt to try to translate the 100 solutions of Project Drawdown into a state-level action plan - why that framework, and how can we in Georgia accomplish it? And where do we start?
Let's explore!
What is the Goal of Drawdown Georgia?
The goal of Drawdown Georgia is to reduce carbon emissions in the state by over a third by the year 2030. This goal aligns with the timeframe of the Paris Climate Accord, which is to limit global warming to no more than 1.5 degrees Celsius (2.7 degrees Fahrenheit) above pre-industrial levels. To achieve that goal, global emissions need to be cut by more than a third by the year 2030 and then proceed to zero by 2050.
No Standard Blueprint for Climate Action at State and Local Levels
The real challenge in meeting the Paris Climate Accord is that there is no standard blueprint for action at the state and local levels. Countless studies have been done on climate challenges and potential solutions, but they all must be tailored to meet the needs, resources, and priorities of individual states and localities.
We set out to fill that gap by providing an example of how states can systematically select solutions to cut carbon emissions in ways that are beneficial and equitable, using the state of Georgia.
Georgia's Baseline Carbon Footprint and Trends
The Drawdown Georgia research team, including researchers at Georgia Tech, the University of Georgia, Emory University, and Georgia State University, spent 18 months working together to understand Georgia’s baseline carbon footprint and trends.
As a starting point, the founding partners began with the list of 100 solutions that was revealed by Paul Hawken in 2018’s Drawdown that were developed to solve for climate change on a global level.
From 100 to 20 Carbon Emission Solutions Based on Science and Focus on Georgia
The researchers gradually whittled down Hawken’s 100 solutions.
First to be eliminated were any not pertinent to Georgia--solutions related to tropical rainforests, for example. That left the team with a list of about 75 that were examined more deeply through a series of five questions:
-
If technology is required, is it ready for the market? Some on the list, such as autonomous vehicles, wouldn’t be applicable by 2030 and were removed from consideration.
-
Do we have sufficient local experience and available data to apply this successfully in Georgia? Here we eliminated solutions related to wave and tidal energy, for example, which are not commonly employed in the southeast.
-
Does the solution provide meaningful opportunities to reduce CO2? We determined that we would only pursue options that would reduce CO2 emissions by one million tons or one megaton.
-
Is it cost-effective? Here solutions like solar water heating and biomass, which just aren’t cost-competitive in the current economy, were removed.
-
What impacts do these solutions have beyond carbon? How will they affect the environment, jobs, public health, and equity? We didn't eliminate anything for beyond carbon reasons, but we did raise some red flags and some caution lights.
Organizing the 20 Carbon Emission Solutions into Five Sectors
The 20 solutions that passed the above criteria are organized into five sectors:
- Buildings & Materials
- Electricity
- Food & Agriculture
- Land Sinks
- Transportation.
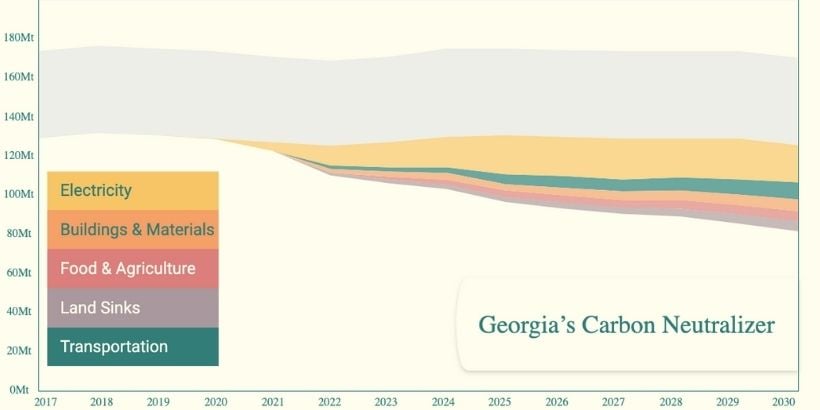
These solutions could bring Georgia's carbon footprint down to 79 megatons, which would represent a 35 percent drop.
The wedge diagram below portrays what can be realistically achieved in the state of Georgia over the next 10 years, with each wedge representing a different solution. The gray bar at the top reflects Georgia’s current carbon sink reservoir - the trees and the coastal wetlands and agricultural soils that are sequestering CO2.
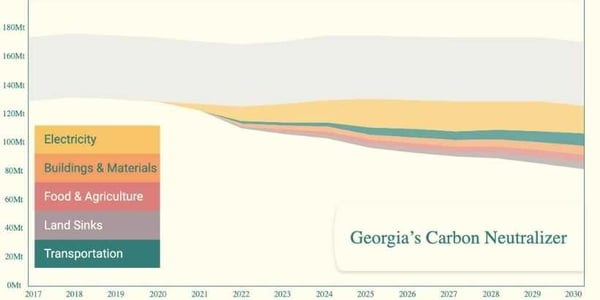
The electricity and transportation sector wedges are the largest on the graph because of the significant impact that solutions like large-scale solar (or solar farms) and energy-efficient trucks are projected to have in the state.
Examining Costs and Benefits Associated with the 20 Solutions of Drawdown Georgia
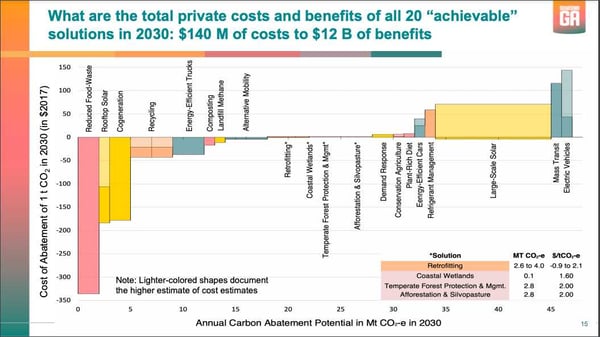
Drawdown Georgia researchers also examined the private costs and benefits that would be needed to realize these 20 solutions.
Many of the solutions were found to have a negative cost, meaning that they will pay for themselves and will save money for individuals, businesses, and/or the state of Georgia over time. Of the solutions, reducing food waste represents the biggest potential for saving money, with adopting electric vehicles being the most costly.
Overall the 20 solutions should cost just $140 million to implement by 2030 but will offer $12 billion in benefits.
While much of the focus is on carbon emissions and financial savings (on an individual, business, or state-wide level) over the next decade, we also see benefits in the areas of equity and social justice, job creation, economic development, environmental protection, and public health.
We invite you to watch the video above to learn more about the science and the methodology behind the 20 carbon emission reduction solutions that Drawdown Georgia focuses on.