TABLE OF CONTENTS
1 INTRODUCTION (Page No. - 38)
1.1 STUDY OBJECTIVES
1.2 MARKET DEFINITION
TABLE 1 INCLUSIONS AND EXCLUSIONS
1.3 STUDY SCOPE
FIGURE 1 SLEEP APNEA DEVICES MARKET SCOPE
1.3.1 YEARS CONSIDERED
1.4 CURRENCY CONSIDERED
1.5 STAKEHOLDERS
1.6 SUMMARY OF CHANGES
2 RESEARCH METHODOLOGY (Page No. - 43)
2.1 RESEARCH DATA
FIGURE 2 SLEEP APNEA DEVICES INDUSTRY: RESEARCH DESIGN METHODOLOGY
2.1.1 SECONDARY DATA
2.1.1.1 Key data from secondary sources
2.1.2 PRIMARY DATA
FIGURE 3 PRIMARY SOURCES
2.1.2.1 Key industry insights
2.1.2.2 Key data from primary sources
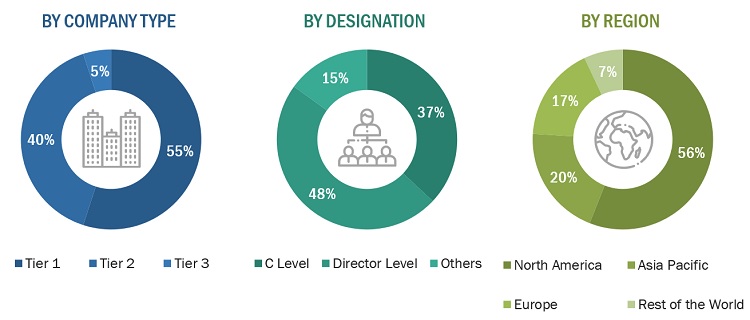
2.1.2.3 Breakdown of primary interviews
FIGURE 4 BREAKDOWN OF PRIMARY INTERVIEWS: BY COMPANY TYPE, DESIGNATION, AND REGION
2.2 MARKET SIZE ESTIMATION
2.2.1 BOTTOM-UP APPROACH
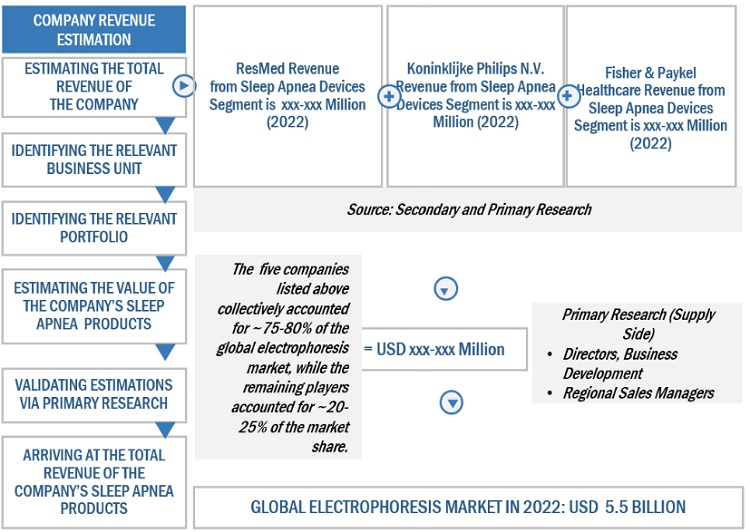
2.2.1.1 Approach 1: Company revenue estimation approach
FIGURE 5 BOTTOM-UP APPROACH: COMPANY REVENUE ESTIMATION APPROACH
2.2.1.2 Approach 2: Presentations of sleep apnea companies and primary interviews
2.2.1.3 Approach 3: Patient-based approach
FIGURE 6 BOTTOM-UP APPROACH: PATIENT-BASED ANALYSIS
2.2.2 GROWTH FORECAST
2.2.3 CAGR PROJECTIONS
FIGURE 7 CAGR PROJECTIONS: SUPPLY SIDE ANALYSIS
2.2.4 TOP-DOWN APPROACH
FIGURE 8 MARKET: TOP-DOWN APPROACH
2.3 DATA TRIANGULATION
FIGURE 9 DATA TRIANGULATION METHODOLOGY
2.4 STUDY ASSUMPTIONS
2.5 RESEARCH LIMITATIONS AND RISK ASSESSMENT
TABLE 2 RISK ASSESSMENT: MARKET
3 EXECUTIVE SUMMARY (Page No. - 56)
FIGURE 10 SLEEP APNEA DEVICES MARKET SIZE, BY TYPE, 2023 VS. 2028 (USD MILLION)
FIGURE 11 SLEEP APNEA DEVICES INDUSTRY FOR THERAPEUTIC DEVICES, BY PRODUCT, 2023 VS. 2028 (USD MILLION)
FIGURE 12 MARKET OVERVIEW FOR DIAGNOSTIC DEVICES, BY PRODUCT, 2023 VS. 2028 (USD MILLION)
FIGURE 13 SLEEP APNEA DIAGNOSTIC DEVICES MARKET, BY END USER, 2023 VS. 2028 (USD MILLION)
FIGURE 14 MARKET SIZE, BY REGION, 2021 VS. 2026 (USD MILLION)
4 PREMIUM INSIGHTS (Page No. - 60)
4.1 SLEEP APNEA DEVICES MARKET OVERVIEW
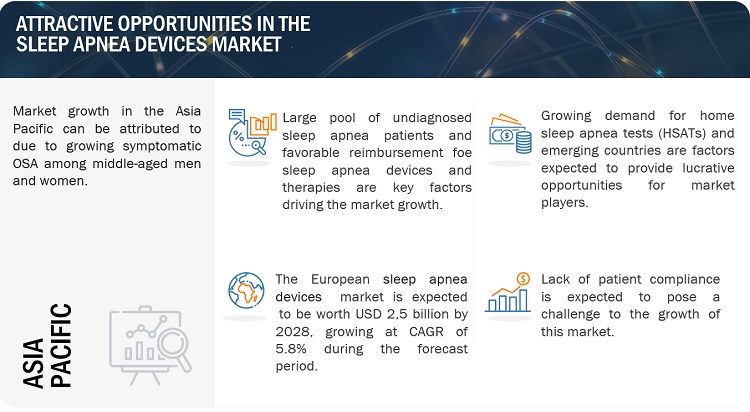
FIGURE 15 LARGE POOL OF UNDIAGNOSED SLEEP APNEA PATIENTS GLOBALLY TO DRIVE MARKET
4.2 SLEEP APNEA DEVICES INDUSTRY, BY REGION (2023–2028)
FIGURE 16 ASIA PACIFIC TO REGISTER HIGHEST CAGR DURING FORECAST PERIOD
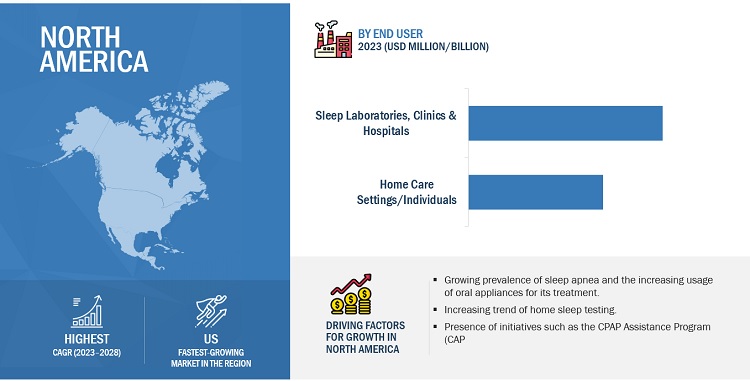
4.3 NORTH AMERICA: SLEEP APNEA DIAGNOSTIC DEVICES MARKET, BY PRODUCT AND COUNTRY (2022)
FIGURE 17 US ACCOUNTED FOR LARGEST SHARE OF NORTH AMERICAN MARKET IN 2022
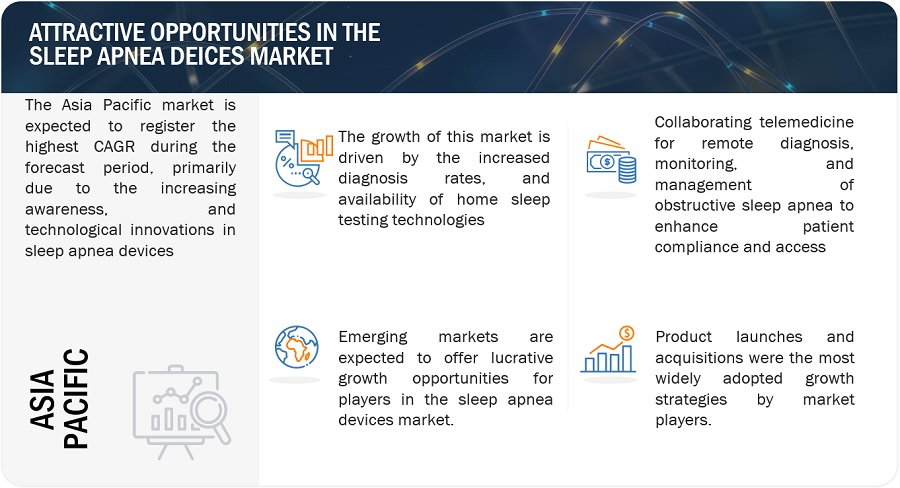
4.4 MARKET: GEOGRAPHICAL GROWTH OPPORTUNITIES
FIGURE 18 ASIA PACIFIC TO GROW AT HIGHEST RATE DURING STUDY PERIOD
5 MARKET OVERVIEW (Page No. - 63)
5.1 INTRODUCTION
5.2 MARKET DYNAMICS (SLEEP APNEA STATISTICS)
FIGURE 19 SLEEP APNEA DEVICES MARKET OVERVIEW: DRIVERS, RESTRAINTS, OPPORTUNITIES, AND CHALLENGES
5.2.1 DRIVERS (SLEEP APNEA STATISTICS)
5.2.1.1 Large pool of undiagnosed sleep apnea patients globally
TABLE 3 PREVALENCE OF SLEEP APNEA IN 2020
5.2.1.2 Favorable reimbursement and financial aid for sleep apnea devices and therapies
TABLE 4 REIMBURSEMENT CODES AND COSTS OF MAJOR SLEEP APNEA DEVICES BY RESMED
TABLE 5 ESTABLISHED CPT CODES PROVIDED BY ITAMAR MEDICAL
5.2.1.3 Growing awareness about effects of untreated sleep apnea among patients
TABLE 6 INITIATIVES TO PROMOTE AWARENESS ABOUT EFFECTS OF UNTREATED SLEEP APNEA
5.2.1.4 Growing usage of oral appliances among patients with mild to low-moderate sleep apnea
TABLE 7 LIST OF ADVANCED ORAL APPLIANCES AVAILABLE FOR TREATING SLEEP APNEA
5.2.1.5 Rising number of companies in sleep apnea devices and oral appliances market
5.2.2 RESTRAINTS (SLEEP APNEA STATISTICS)
5.2.2.1 High cost of CPAP machines and minimal insurance access in developing countries
5.2.2.2 Complex referral pathways, long waiting periods, and delayed diagnosis
5.2.2.3 Alternative therapies and medications for sleep apnea
5.2.3 OPPORTUNITIES (SLEEP APNEA STATISTICS)
5.2.3.1 Growing demand for home sleep apnea tests as cost-saving measure
5.2.3.2 Increasing focus on telemedicine, mHealth, and AI
5.2.3.3 Increased interest of sleep apnea device manufacturers toward emerging markets
5.2.4 CHALLENGES (SLEEP APNEA STATISTICS)
5.2.4.1 Poor patient compliance associated with CPAP therapy
5.3 PRICING ANALYSIS
TABLE 8 AVERAGE SELLING PRICE OF PAP DEVICES
TABLE 9 AVERAGE SELLING PRICE OF FACIAL INTERFACES
TABLE 10 AVERAGE SELLING PRICE OF SLEEP APNEA ORAL APPLIANCES
TABLE 11 COST OF SLEEP APNEA TESTING METHODS
TABLE 12 AVERAGE SELLING PRICE OF SLEEP APNEA DEVICES, BY KEY PLAYER
5.4 VALUE CHAIN ANALYSIS (SLEEP APNEA STATISTICS)
FIGURE 20 VALUE CHAIN ANALYSIS: MAJOR VALUE ADDED DURING MANUFACTURING AND ASSEMBLY PHASES
5.5 SUPPLY CHAIN ANALYSIS
FIGURE 21 DIRECT DISTRIBUTION TO BE PREFERRED STRATEGY OF PROMINENT SLEEP APNEA COMPANIES
5.6 PORTER’S FIVE FORCES ANALYSIS
5.6.1 THREAT OF NEW ENTRANTS
5.6.2 THREAT OF SUBSTITUTES
5.6.3 BARGAINING POWER OF SUPPLIERS
5.6.4 BARGAINING POWER OF BUYERS
5.6.5 INTENSITY OF COMPETITIVE RIVALRY
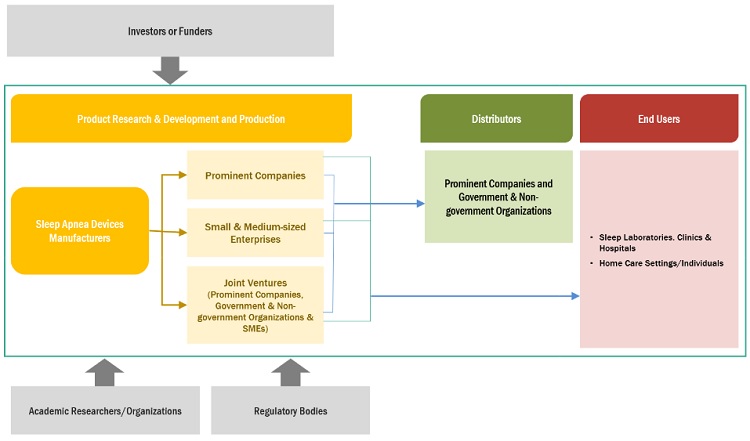
5.7 ECOSYSTEM ANALYSIS
FIGURE 22 SLEEP APNEA DEVICES INDUSTRY: ECOSYSTEM ANALYSIS
5.7.1 ROLE IN ECOSYSTEM
FIGURE 23 KEY PLAYERS IN MARKET ECOSYSTEM
5.8 REGULATORY ANALYSIS
TABLE 13 INDICATIVE LIST OF REGULATORY AUTHORITIES GOVERNING SLEEP APNEA DEVICES
5.8.1 NORTH AMERICA
5.8.1.1 US
TABLE 14 US: MEDICAL DEVICE REGULATORY APPROVAL PROCESS
5.8.1.1.1 Reimbursement scenario in US
5.8.1.2 Canada
TABLE 15 CANADA: MEDICAL DEVICE REGULATORY APPROVAL PROCESS
5.8.2 EUROPE
5.8.3 ASIA PACIFIC
5.8.3.1 Japan
TABLE 16 JAPAN: MEDICAL DEVICE CLASSIFICATION UNDER PMDA
5.8.3.2 China
TABLE 17 CHINA: CLASSIFICATION OF MEDICAL DEVICES
5.8.3.3 India
5.8.3.4 Australia
5.9 PATENT ANALYSIS
5.9.1 PATENT TRENDS FOR SLEEP APNEA DEVICES
FIGURE 24 PATENT TRENDS FOR SLEEP APNEA DEVICES, JANUARY 2012–DECEMBER 2022
5.9.2 JURISDICTION AND TOP APPLICANT ANALYSIS
FIGURE 25 TOP APPLICANTS AND OWNERS (SLEEP APNEA COMPANIES/INSTITUTIONS) FOR SLEEP APNEA ORAL APPLIANCE PATENTS, JANUARY 2012–DECEMBER 2022
5.10 TRENDS/DISRUPTIONS IMPACTING CUSTOMERS’ BUSINESSES
5.10.1 REVENUE SHIFT AND REVENUE POCKETS FOR SLEEP APNEA ORAL APPLIANCE MANUFACTURERS
FIGURE 26 REVENUE SHIFT FOR SLEEP APNEA DEVICES
5.11 KEY CONFERENCES AND EVENTS IN 2022–2023
TABLE 18 MARKET: DETAILED LIST OF CONFERENCES AND EVENTS IN 2022–2023
5.12 TECHNOLOGY ANALYSIS
5.13 KEY STAKEHOLDERS AND BUYING CRITERIA
5.13.1 KEY STAKEHOLDERS IN BUYING PROCESS
FIGURE 27 INFLUENCE OF STAKEHOLDERS ON BUYING PROCESS OF SLEEP APNEA DEVICES
TABLE 19 INFLUENCE OF STAKEHOLDERS ON BUYING PROCESS OF SLEEP APNEA DEVICES (%)
5.13.2 BUYING CRITERIA
FIGURE 28 KEY BUYING CRITERIA FOR END USERS OF SLEEP APNEA DEVICES
TABLE 20 KEY BUYING CRITERIA FOR END USERS OF SLEEP APNEA DEVICES
5.14 TRADE ANALYSIS
5.14.1 IMPORT DATA FOR HS CODE 901849, BY COUNTRY, 2018–2022 (USD MILLION)
5.14.2 EXPORT DATA FOR HS CODE 901849, BY COUNTRY, 2018–2022 (USD MILLION)
6 SLEEP APNEA DEVICES MARKET SEGMENTS: EPIDEMIOLOGICAL ASSESSMENT (Page No. - 95)
6.1 MARKET ANALYSIS: INTRODUCTION
6.2 EPIDEMIOLOGICAL ASSESSMENT
FIGURE 29 TOP TEN COUNTRIES WITH HIGHEST OBSTRUCTIVE SLEEP APNEA PATIENTS (BASED ON AMERICAN ACADEMY OF SLEEP MEDICINE, 2012)
6.3 PRESCRIPTION PATTERN ASSESSMENT
6.4 ADHERENCE ASSESSMENT
7 SLEEP APNEA DEVICES MARKET SEGMENTS: ALTERNATE THERAPIES (Page No. - 100)
7.1 MARKET ANALYSIS: INTRODUCTION
7.2 EXPIRATORY POSITIVE AIRWAY PRESSURE
7.3 HYPOGLOSSAL NERVE STIMULATION
7.4 ORAL PRESSURE THERAPY
7.5 POSITIONAL THERAPY
8 SLEEP APNEA DEVICES MARKET REPORT, BY TYPE (Page No. - 103)
8.1 INTRODUCTION
TABLE 21 SLEEP APNEA DEVICES INDUSTRY, BY TYPE, 2021–2028 (USD MILLION)
8.2 THERAPEUTIC DEVICES
TABLE 22 MARKET PREDICTION FOR THERAPEUTIC DEVICES, BY PRODUCT, 2021–2028 (USD MILLION)
TABLE 23 MARKET PREDICTION FOR THERAPEUTIC DEVICES, BY REGION, 2021–2028 (USD MILLION)
8.2.1 PAP DEVICES
TABLE 24 PAP DEVICES MARKET, BY TYPE, 2021–2028 (USD MILLION)
TABLE 25 PAP DEVICES MARKET, BY REGION, 2021–2028 (USD MILLION)
8.2.1.1 CPAP devices
8.2.1.1.1 CPAP devices to provide best standard sleep apnea treatment for patients globally
TABLE 26 CPAP DEVICES OFFERED BY KEY PLAYERS
TABLE 27 CPAP DEVICES MARKET, BY REGION, 2021–2028 (USD MILLION)
8.2.1.2 APAP devices
8.2.1.2.1 Increasing patient non-compliance with CPAP devices and growing awareness among sleep specialists to boost segment
TABLE 28 APAP DEVICES MARKET, BY REGION, 2021–2028 (USD MILLION)
8.2.1.3 BPAP devices
8.2.1.3.1 Increased complexity and cost with high product recalls from major sleepa apnea companies to lower adoption
TABLE 29 BPAP DEVICES OFFERED BY KEY PLAYERS
TABLE 30 BPAP DEVICES MARKET, BY REGION, 2021–2028 (USD MILLION)
8.2.2 FACIAL INTERFACES
TABLE 31 FACIAL INTERFACES MARKET, BY TYPE, 2021–2028 (USD MILLION)
TABLE 32 FACIAL INTERFACES MARKET, BY REGION, 2021–2028 (USD MILLION)
8.2.2.1 Masks
TABLE 33 MASKS OFFERED BY KEY PLAYERS
TABLE 34 MASKS MARKET, BY TYPE, 2021–2028 (USD MILLION)
TABLE 35 MASKS MARKET, BY REGION, 2021–2028 (USD MILLION)
8.2.2.1.1 Full-face masks
8.2.2.1.1.1 Full-face masks to be most effective for mouth breathers or patients struggling with breathing through nose
TABLE 36 FULL-FACE MASKS OFFERED BY KEY PLAYERS
TABLE 37 FULL-FACE MASKS MARKET, BY REGION, 2021–2028 (USD MILLION)
8.2.2.1.2 Nasal pillow masks
8.2.2.1.2.1 Greater patient compliance due to smaller size and better fit to drive demand
TABLE 38 NASAL PILLOW MASKS OFFERED BY KEY PLAYERS
TABLE 39 NASAL PILLOW MASKS MARKET, BY REGION, 2021–2028 (USD MILLION)
8.2.2.1.3 Nasal masks
8.2.2.1.3.1 Nasal masks to minimize obstruction of patients’ view and allow patients to wear spectacles
TABLE 40 NASAL MASKS MARKET, BY REGION, 2021–2028 (USD MILLION)
8.2.2.2 Cushions
8.2.2.2.1 Different product varieties and launches by major sleep apnea companies in past few years to drive market
TABLE 41 CUSHIONS OFFERED BY KEY PLAYERS
TABLE 42 CUSHIONS MARKET, BY REGION, 2021–2028 (USD MILLION)
8.2.3 ACCESSORIES
TABLE 43 ACCESSORIES MARKET, BY TYPE, 2021–2028 (USD MILLION)
TABLE 44 ACCESSORIES MARKET, BY REGION, 2021–2028 (USD MILLION)
8.2.3.1 Humidifier accessories
8.2.3.1.1 Humidifiers to open airways, decrease congestion, and encourage clearer breathing
TABLE 45 HUMIDIFIER ACCESSORIES MARKET, BY REGION, 2021–2028 (USD MILLION)
8.2.3.2 Power accessories
8.2.3.2.1 Power accessories to manage uninterrupted sleep apnea therapy in absence of power supply
TABLE 46 POWER ACCESSORIES MARKET, BY REGION, 2021–2028 (USD MILLION)
8.2.3.3 Transportation accessories
8.2.3.3.1 Convenience associated with transportation accessories while traveling to drive market
TABLE 47 TRANSPORTATION ACCESSORIES MARKET, BY REGION, 2021–2028 (USD MILLION)
8.2.3.4 Communication accessories
8.2.3.4.1 Communication accessories to monitor sleep apnea symptoms through teleconsultations
TABLE 48 COMMUNICATION ACCESSORIES MARKET, BY REGION, 2021–2028 (USD MILLION)
8.2.3.5 Chin restraints
8.2.3.5.1 Chin restraints to hold mouth in position during therapy
TABLE 49 CHIN RESTRAINTS MARKET, BY REGION, 2021–2028 (USD MILLION)
8.2.3.6 Other accessories
TABLE 50 OTHER ACCESSORIES MARKET, BY REGION, 2021–2028 (USD MILLION)
8.2.4 ORAL APPLIANCES
TABLE 51 ORAL APPLIANCES OFFERED BY KEY PLAYERS
TABLE 52 ORAL APPLIANCES MARKET, BY TYPE, 2021–2028 (USD MILLION)
TABLE 53 ORAL APPLIANCES MARKET, BY REGION, 2021–2028 (USD MILLION)
8.2.4.1 Mandibular advancement devices
8.2.4.1.1 Mandibular advancement devices to treat mild obstructive sleep apnea and snoring
TABLE 54 MANDIBULAR ADVANCEMENT DEVICES MARKET, BY REGION, 2021–2028 (USD MILLION)
8.2.4.2 Tongue-retaining devices
8.2.4.2.1 Tongue-retaining devices to be less expensive and reduce both snoring and sleep apnea
TABLE 55 TONGUE-RETAINING DEVICES MARKET, BY REGION, 2021–2028 (USD MILLION)
8.2.5 ADAPTIVE SERVO-VENTILATORS
8.2.5.1 Improved clinical outcomes associated and better ventilation support as per breathing patterns to fuel market
TABLE 56 ADAPTIVE SERVO-VENTILATORS MARKET, BY REGION, 2021–2028 (USD MILLION)
8.2.6 OTHER THERAPEUTIC DEVICES
TABLE 57 OTHER THERAPEUTIC DEVICES OFFERED BY KEY PLAYERS
TABLE 58 OTHER THERAPEUTIC DEVICES MARKET, BY REGION, 2021–2028 (USD MILLION)
8.3 DIAGNOSTIC DEVICES
TABLE 59 MARKET FOR DIAGNOSTIC DEVICES, BY PRODUCT, 2021–2028 (USD MILLION)
TABLE 60 MARKET FOR DIAGNOSTIC DEVICES, BY REGION, 2021–2028 (USD MILLION)
8.3.1 PSG DEVICES
TABLE 61 PSG DEVICES OFFERED BY KEY PLAYERS
TABLE 62 PSG DEVICES MARKET, BY TYPE, 2021–2028 (USD MILLION)
TABLE 63 PSG DEVICES MARKET, BY REGION, 2021–2028 (USD MILLION)
8.3.1.1 Ambulatory PSG devices
8.3.1.1.1 Cost-effectiveness and convenience for patients to propel segment
TABLE 64 AMBULATORY PSG DEVICES MARKET, BY REGION, 2021–2028 (USD MILLION)
8.3.1.2 Clinical PSG devices
8.3.1.2.1 Requirement of constant supervision to limit segment growth
TABLE 65 CLINICAL PSG DEVICES OFFERED BY KEY PLAYERS
TABLE 66 CLINICAL PSG DEVICES MARKET, BY REGION, 2021–2028 (USD MILLION)
8.3.2 HOME SLEEP TESTING DEVICES
8.3.2.1 Cost-effectiveness and comfort of home sleep testing to augment segment
TABLE 67 HOME SLEEP TESTING DEVICES MARKET, BY REGION, 2021–2028 (USD MILLION)
8.3.3 OXIMETERS
TABLE 68 OXIMETERS MARKET, BY TYPE, 2021–2028 (USD MILLION)
TABLE 69 OXIMETERS MARKET, BY REGION, 2021–2028 (USD MILLION)
8.3.3.1 Fingertip oximeters
8.3.3.1.1 Lack of precise readings because of injury or slow blood flow due to blood clotting to limit segment
TABLE 70 FINGERTIP OXIMETERS OFFERED BY KEY PLAYERS
TABLE 71 FINGERTIP OXIMETERS MARKET, BY REGION, 2021–2028 (USD MILLION)
8.3.3.2 Handheld oximeters
8.3.3.2.1 Handheld oximeters to be more expensive than fingertips and wrist-worn oximeters
TABLE 72 HANDHELD OXIMETERS OFFERED BY KEY PLAYERS
TABLE 73 HANDHELD OXIMETERS MARKET, BY REGION, 2021–2028 (USD MILLION)
8.3.3.3 Wrist-worn oximeters
8.3.3.3.1 Small size, long-term usage, and need for overnight monitoring to propel segment
TABLE 74 WRIST-WORN OXIMETERS OFFERED BY KEY PLAYERS
TABLE 75 WRIST-WORN OXIMETERS MARKET, BY REGION, 2021–2028 (USD MILLION)
8.3.3.4 TABLEtop oximeters
8.3.3.4.1 Higher cost and fewer applications for personal use to decrease market share
TABLE 76 TABLETOP OXIMETERS OFFERED BY KEY PLAYERS
TABLE 77 TABLETOP OXIMETERS MARKET, BY REGION, 2021–2028 (USD MILLION)
8.3.4 ACTIGRAPHY SYSTEMS
8.3.4.1 Increased focus on assessing actimeter performance to enhance market
TABLE 78 ACTIGRAPHY MARKET, BY REGION, 2021–2028 (USD MILLION)
8.3.5 SLEEP SCREENING DEVICES
8.3.5.1 Increasing preference for home-based testing for its efficacy and comfort to drive market
TABLE 79 SLEEP SCREENING DEVICES OFFERED BY KEY PLAYERS
TABLE 80 SLEEP SCREENING DEVICES MARKET, BY REGION, 2021–2028 (USD MILLION)
9 SLEEP APNEA DEVICES MARKET REPORT, BY END USER (Page No. - 143)
9.1 INTRODUCTION
TABLE 81 SLEEP APNEA DEVICES INDUSTRY, BY END USER, 2021–2028 (USD MILLION)
9.2 SLEEP LABORATORIES, CLINICS, AND HOSPITALS
9.2.1 RAPID DEVELOPMENT IN HEALTHCARE INFRASTRUCTURE TO DRIVE MARKET
TABLE 82 SLEEP APNEA DIAGNOSTIC DEVICES MARKET FOR SLEEP LABORATORIES, CLINICS, AND HOSPITALS, BY REGION, 2021–2028 (USD MILLION)
9.3 HOME CARE SETTINGS/INDIVIDUALS
9.3.1 INCREASING PATIENT PREFERENCE FOR HOME-BASED SLEEP TESTS TO FUEL MARKET
TABLE 83 MARKET SIZE FOR HOME CARE SETTINGS/INDIVIDUALS, BY REGION, 2021–2028 (USD MILLION)
10 SLEEP APNEA DEVICES MARKET REPORT, BY REGION (Page No. - 148)
10.1 INTRODUCTION
TABLE 84 SLEEP APNEA DEVICES INDUSTRY, BY REGION, 2021–2028 (USD MILLION)
10.2 NORTH AMERICA
10.2.1 NORTH AMERICA: IMPACT OF ECONOMIC RECESSION
FIGURE 30 NORTH AMERICA: SLEEP APNEA DEVICES MARKET SNAPSHOT
TABLE 85 NORTH AMERICA: MARKET ANALYSIS, BY COUNTRY, 2021–2028 (USD MILLION)
TABLE 86 NORTH AMERICA: SLEEP APNEA DIAGNOSTIC DEVICES MARKET, BY TYPE, 2021–2028 (USD MILLION)
TABLE 87 NORTH AMERICA: MARKET SEGMENTS FOR THERAPEUTIC DEVICES, BY PRODUCT, 2021–2028 (USD MILLION)
TABLE 88 NORTH AMERICA: PAP DEVICES MARKET, BY TYPE, 2021–2028 (USD MILLION)
TABLE 89 NORTH AMERICA: FACIAL INTERFACES MARKET, BY TYPE, 2021–2028 (USD MILLION)
TABLE 90 NORTH AMERICA: MASKS MARKET, BY TYPE, 2021–2028 (USD MILLION)
TABLE 91 NORTH AMERICA: ACCESSORIES MARKET, BY TYPE, 2021–2028 (USD MILLION)
TABLE 92 NORTH AMERICA: ORAL APPLIANCES MARKET, BY TYPE, 2021–2028 (USD MILLION)
TABLE 93 NORTH AMERICA: MARKET PREDICTION FOR DIAGNOSTIC DEVICES, BY PRODUCT, 2021–2028 (USD MILLION)
TABLE 94 NORTH AMERICA: PSG DEVICES MARKET, BY TYPE, 2021–2028 (USD MILLION)
TABLE 95 NORTH AMERICA: OXIMETERS MARKET, BY TYPE, 2021–2028 (USD MILLION)
TABLE 96 NORTH AMERICA: SLEEP APNEA DEVICES MARKET OVERVIEW, BY END USER, 2021–2028 (USD MILLION)
10.2.2 US
10.2.2.1 Rising availability of grants and funds and increasing trend of home sleep testing to drive market
TABLE 97 KEY SLEEP APNEA PRODUCTS PROVIDED BY MAJOR PLAYERS IN US
TABLE 98 US: SLEEP APNEA DEVICES MARKET SIZE, BY TYPE, 2021–2028 (USD MILLION)
TABLE 99 US: SLEEP APNEA DIAGNOSTIC DEVICES MARKET FOR THERAPEUTIC DEVICES, BY PRODUCT, 2021–2028 (USD MILLION)
TABLE 100 US: PAP DEVICES MARKET, BY TYPE, 2021–2028 (USD MILLION)
TABLE 101 US: FACIAL INTERFACES MARKET, BY TYPE, 2021–2028 (USD MILLION)
TABLE 102 US: MASKS MARKET, BY TYPE, 2021–2028 (USD MILLION)
TABLE 103 US: ACCESSORIES MARKET, BY TYPE, 2021–2028 (USD MILLION)
TABLE 104 US: ORAL APPLIANCES MARKET, BY TYPE, 2021–2028 (USD MILLION)
TABLE 105 US: MARKET REPORT FOR DIAGNOSTIC DEVICES, BY PRODUCT, 2021–2028 (USD MILLION)
TABLE 106 US: PSG DEVICES MARKET, BY TYPE, 2021–2028 (USD MILLION)
TABLE 107 US: OXIMETERS MARKET, BY TYPE, 2021–2028 (USD MILLION)
TABLE 108 US: SLEEP APNEA DEVICES MARKET OVERVIEW, BY END USER, 2021–2028 (USD MILLION)
10.2.3 CANADA
10.2.3.1 Increasing number of research grants and health programs to propel market
TABLE 109 KEY SLEEP APNEA PRODUCTS PROVIDED BY MAJOR PLAYERS IN CANADA
TABLE 110 CANADA: SLEEP APNEA DEVICES MARKET SHARE, BY TYPE, 2021–2028 (USD MILLION)
TABLE 111 CANADA: SLEEP APNEA DIAGNOSTIC DEVICES MARKET FOR THERAPEUTIC DEVICES, BY PRODUCT, 2021–2028 (USD MILLION)
TABLE 112 CANADA: PAP DEVICES MARKET, BY TYPE, 2021–2028 (USD MILLION)
TABLE 113 CANADA: FACIAL INTERFACES MARKET, BY TYPE, 2021–2028 (USD MILLION)
TABLE 114 CANADA: MASKS MARKET, BY TYPE, 2021–2028 (USD MILLION)
TABLE 115 CANADA: ACCESSORIES MARKET, BY TYPE, 2021–2028 (USD MILLION)
TABLE 116 CANADA: ORAL APPLIANCES MARKET, BY TYPE, 2021–2028 (USD MILLION)
TABLE 117 CANADA: MARKET PREDICTION FOR DIAGNOSTIC DEVICES, BY PRODUCT, 2021–2028 (USD MILLION)
TABLE 118 CANADA: PSG DEVICES MARKET, BY TYPE, 2021–2028 (USD MILLION)
TABLE 119 CANADA: OXIMETERS MARKET, BY TYPE, 2021–2028 (USD MILLION)
TABLE 120 CANADA: SLEEP APNEA DEVICES MARKET GROWTH, BY END USER, 2021–2028 (USD MILLION)
10.3 EUROPE
10.3.1 EUROPE: IMPACT OF ECONOMIC RECESSION
TABLE 121 EUROPE: SLEEP APNEA DEVICES MARKET SHARE, BY COUNTRY, 2021–2028 (USD MILLION)
TABLE 122 EUROPE: SLEEP APNEA DIAGNOSTIC DEVICES MARKET, BY TYPE, 2021–2028 (USD MILLION)
TABLE 123 EUROPE: MARKET SEGMENTS FOR THERAPEUTIC DEVICES, BY PRODUCT, 2021–2028 (USD MILLION)
TABLE 124 EUROPE: PAP DEVICES MARKET, BY TYPE, 2021–2028 (USD MILLION)
TABLE 125 EUROPE: FACIAL INTERFACES MARKET, BY TYPE, 2021–2028 (USD MILLION)
TABLE 126 EUROPE: MASKS MARKET, BY TYPE, 2021–2028 (USD MILLION)
TABLE 127 EUROPE: ACCESSORIES MARKET, BY TYPE, 2021–2028 (USD MILLION)
TABLE 128 EUROPE: ORAL APPLIANCES MARKET, BY TYPE, 2021–2028 (USD MILLION)
TABLE 129 EUROPE: SLEEP APNEA DEVICES MARKET GROWTHFOR DIAGNOSTIC DEVICES, BY PRODUCT, 2021–2028 (USD MILLION)
TABLE 130 EUROPE: PSG DEVICES MARKET, BY TYPE, 2021–2028 (USD MILLION)
TABLE 131 EUROPE: OXIMETERS MARKET, BY TYPE, 2021–2028 (USD MILLION)
TABLE 132 EUROPE: SLEEP APNEA DEVICES INDUSTRY, BY END USER, 2021–2028 (USD MILLION)
10.3.2 GERMANY
10.3.2.1 High prevalence of obstructive sleep apnea primarily due to smoking to fuel market
TABLE 133 KEY SLEEP APNEA PRODUCTS BY MAJOR PLAYERS IN GERMANY
TABLE 134 GERMANY: SLEEP APNEA DEVICES MARKET SHARE, BY TYPE, 2021–2028 (USD MILLION)
TABLE 135 GERMANY: SLEEP APNEA DIAGNOSTIC DEVICES MARKET FOR THERAPEUTIC DEVICES, BY PRODUCT, 2021–2028 (USD MILLION)
TABLE 136 GERMANY: PAP DEVICES MARKET, BY TYPE, 2021–2028 (USD MILLION)
TABLE 137 GERMANY: FACIAL INTERFACES MARKET, BY TYPE, 2021–2028 (USD MILLION)
TABLE 138 GERMANY: MASKS MARKET, BY TYPE, 2021–2028 (USD MILLION)
TABLE 139 GERMANY: ACCESSORIES MARKET, BY TYPE, 2021–2028 (USD MILLION)
TABLE 140 GERMANY: ORAL APPLIANCES MARKET, BY TYPE, 2021–2028 (USD MILLION)
TABLE 141 GERMANY: MARKET PREDICTION FOR DIAGNOSTIC DEVICES, BY PRODUCT, 2021–2028 (USD MILLION)
TABLE 142 GERMANY: PSG DEVICES MARKET, BY TYPE, 2021–2028 (USD MILLION)
TABLE 143 GERMANY: OXIMETERS MARKET, BY TYPE, 2021–2028 (USD MILLION)
TABLE 144 GERMANY: SLEEP APNEA DEVICES MARKET GROWTH, BY END USER, 2021–2028 (USD MILLION)
10.3.3 FRANCE
10.3.3.1 Rising geriatric population to increase incidence of sleep apnea
TABLE 145 FRANCE: SLEEP APNEA DEVICES MARKET SHARE, BY TYPE, 2021–2028 (USD MILLION)
TABLE 146 FRANCE: SLEEP APNEA DIAGNOSTIC DEVICES MARKET FOR THERAPEUTIC DEVICES, BY PRODUCT, 2021–2028 (USD MILLION)
TABLE 147 FRANCE: PAP DEVICES MARKET, BY TYPE, 2021–2028 (USD MILLION)
TABLE 148 FRANCE: FACIAL INTERFACES MARKET, BY TYPE, 2021–2028 (USD MILLION)
TABLE 149 FRANCE: MASKS MARKET, BY TYPE, 2021–2028 (USD MILLION)
TABLE 150 FRANCE: ACCESSORIES MARKET, BY TYPE, 2021–2028 (USD MILLION)
TABLE 151 FRANCE: ORAL APPLIANCES MARKET, BY TYPE, 2021–2028 (USD MILLION)
TABLE 152 FRANCE: MARKET FOR DIAGNOSTIC DEVICES, BY PRODUCT, 2021–2028 (USD MILLION)
TABLE 153 FRANCE: PSG DEVICES MARKET, BY TYPE, 2021–2028 (USD MILLION)
TABLE 154 FRANCE: OXIMETERS MARKET, BY TYPE, 2021–2028 (USD MILLION)
TABLE 155 FRANCE: SLEEP APNEA DEVICES MARKET GROWTH, BY END USER, 2021–2028 (USD MILLION)
10.3.4 UK
10.3.4.1 Rising awareness among patients and increasing number of sleep service groups to support market
TABLE 156 UK: SLEEP APNEA DEVICES MARKET SHARE, BY TYPE, 2021–2028 (USD MILLION)
TABLE 157 UK: SLEEP APNEA DIAGNOSTIC DEVICES MARKET FOR THERAPEUTIC DEVICES, BY PRODUCT, 2021–2028 (USD MILLION)
TABLE 158 UK: PAP DEVICES MARKET, BY TYPE, 2021–2028 (USD MILLION)
TABLE 159 UK: FACIAL INTERFACES MARKET, BY TYPE, 2021–2028 (USD MILLION)
TABLE 160 UK: MASKS MARKET, BY TYPE, 2021–2028 (USD MILLION)
TABLE 161 UK: ACCESSORIES MARKET, BY TYPE, 2021–2028 (USD MILLION)
TABLE 162 UK: ORAL APPLIANCES MARKET, BY TYPE, 2021–2028 (USD MILLION)
TABLE 163 UK: SLEEP APNEA DEVICES MARKET GROWTH FOR DIAGNOSTIC DEVICES, BY PRODUCT, 2021–2028 (USD MILLION)
TABLE 164 UK: PSG DEVICES MARKET, BY TYPE, 2021–2028 (USD MILLION)
TABLE 165 UK: OXIMETERS MARKET, BY TYPE, 2021–2028 (USD MILLION)
TABLE 166 UK: SLEEP APNEA DEVICES INDUSTRY, BY END USER, 2021–2028 (USD MILLION)
10.3.5 ITALY
10.3.5.1 Growing prevalence of sleep apnea and increasing awareness among patients regarding ill effects of disease to aid market
TABLE 167 ITALY: SLEEP APNEA DEVICES MARKET FORECAST, BY TYPE, 2021–2028 (USD MILLION)
TABLE 168 ITALY: SLEEP APNEA DIAGNOSTIC DEVICES MARKET FOR THERAPEUTIC DEVICES, BY PRODUCT, 2021–2028 (USD MILLION)
TABLE 169 ITALY: PAP DEVICES MARKET, BY TYPE, 2021–2028 (USD MILLION)
TABLE 170 ITALY: FACIAL INTERFACES MARKET, BY TYPE, 2021–2028 (USD MILLION)
TABLE 171 ITALY: MASKS MARKET, BY TYPE, 2021–2028 (USD MILLION)
TABLE 172 ITALY: ACCESSORIES MARKET, BY TYPE, 2021–2028 (USD MILLION)
TABLE 173 ITALY: ORAL APPLIANCES MARKET, BY TYPE, 2021–2028 (USD MILLION)
TABLE 174 ITALY: MARKET FOR DIAGNOSTIC DEVICES, BY PRODUCT, 2021–2028 (USD MILLION)
TABLE 175 ITALY: PSG DEVICES MARKET, BY TYPE, 2021–2028 (USD MILLION)
TABLE 176 ITALY: OXIMETERS MARKET, BY TYPE, 2021–2028 (USD MILLION)
TABLE 177 ITALY: SLEEP APNEA DEVICES MARKET REPORT, BY END USER, 2021–2028 (USD MILLION)
10.3.6 SPAIN
10.3.6.1 Increasing initiatives for social awareness regarding illness and treatment by regional organizations to drive market
TABLE 178 SPAIN: SLEEP APNEA DEVICES MARKET FORECAST, BY TYPE, 2021–2028 (USD MILLION)
TABLE 179 SPAIN: SLEEP APNEA DIAGNOSTIC DEVICES MARKET FOR THERAPEUTIC DEVICES, BY PRODUCT, 2021–2028 (USD MILLION)
TABLE 180 SPAIN: PAP DEVICES MARKET, BY TYPE, 2021–2028 (USD MILLION)
TABLE 181 SPAIN: FACIAL INTERFACES MARKET, BY TYPE, 2021–2028 (USD MILLION)
TABLE 182 SPAIN: MASKS MARKET, BY TYPE, 2021–2028 (USD MILLION)
TABLE 183 SPAIN: ACCESSORIES MARKET, BY TYPE, 2021–2028 (USD MILLION)
TABLE 184 SPAIN: ORAL APPLIANCES MARKET, BY TYPE, 2021–2028 (USD MILLION)
TABLE 185 SPAIN: MARKET FOR DIAGNOSTIC DEVICES, BY PRODUCT, 2021–2028 (USD MILLION)
TABLE 186 SPAIN: PSG DEVICES MARKET, BY TYPE, 2021–2028 (USD MILLION)
TABLE 187 SPAIN: OXIMETERS MARKET, BY TYPE, 2021–2028 (USD MILLION)
TABLE 188 SPAIN: MARKET, BY END USER, 2021–2028 (USD MILLION)
10.3.7 REST OF EUROPE
TABLE 189 REST OF EUROPE: SLEEP APNEA DEVICES MARKET FORECAST, BY TYPE, 2021–2028 (USD MILLION)
TABLE 190 REST OF EUROPE: SLEEP APNEA DIAGNOSTIC DEVICES MARKET FOR THERAPEUTIC DEVICES, BY PRODUCT, 2021–2028 (USD MILLION)
TABLE 191 REST OF EUROPE: PAP DEVICES MARKET, BY TYPE, 2021–2028 (USD MILLION)
TABLE 192 REST OF EUROPE: FACIAL INTERFACES MARKET, BY TYPE, 2021–2028 (USD MILLION)
TABLE 193 REST OF EUROPE: MASKS MARKET, BY TYPE, 2021–2028 (USD MILLION)
TABLE 194 REST OF EUROPE: ACCESSORIES MARKET, BY TYPE, 2021–2028 (USD MILLION)
TABLE 195 REST OF EUROPE: ORAL APPLIANCES MARKET, BY TYPE, 2021–2028 (USD MILLION)
TABLE 196 REST OF EUROPE: MARKET FOR DIAGNOSTIC DEVICES, BY PRODUCT, 2021–2028 (USD MILLION)
TABLE 197 REST OF EUROPE: PSG DEVICES MARKET, BY TYPE, 2021–2028 (USD MILLION)
TABLE 198 REST OF EUROPE: OXIMETERS MARKET, BY TYPE, 2021–2028 (USD MILLION)
TABLE 199 REST OF EUROPE: SLEEP APNEA DEVICES INDUSTRY, BY END USER, 2021–2028 (USD MILLION)
10.4 ASIA PACIFIC
10.4.1 ASIA PACIFIC: IMPACT OF ECONOMIC RECESSION
FIGURE 31 ASIA PACIFIC: SLEEP APNEA DEVICES MARKET SNAPSHOT
TABLE 200 ASIA PACIFIC: SLEEP APNEA DIAGNOSTIC DEVICES MARKET, BY COUNTRY, 2021–2028 (USD MILLION)
TABLE 201 ASIA PACIFIC: MARKET ANALYSIS, BY TYPE, 2021–2028 (USD MILLION)
TABLE 202 ASIA PACIFIC: MARKET SEGMENTS FOR THERAPEUTIC DEVICES, BY PRODUCT, 2021–2028 (USD MILLION)
TABLE 203 ASIA PACIFIC: PAP DEVICES MARKET, BY TYPE, 2021–2028 (USD MILLION)
TABLE 204 ASIA PACIFIC: FACIAL INTERFACES MARKET, BY TYPE, 2021–2028 (USD MILLION)
TABLE 205 ASIA PACIFIC: MASKS MARKET, BY TYPE, 2021–2028 (USD MILLION)
TABLE 206 ASIA PACIFIC: ACCESSORIES MARKET, BY TYPE, 2021–2028 (USD MILLION)
TABLE 207 ASIA PACIFIC: ORAL APPLIANCES MARKET, BY TYPE, 2021–2028 (USD MILLION)
TABLE 208 ASIA PACIFIC: MARKET FOR DIAGNOSTIC DEVICES, BY PRODUCT, 2021–2028 (USD MILLION)
TABLE 209 ASIA PACIFIC: PSG DEVICES MARKET, BY TYPE, 2021–2028 (USD MILLION)
TABLE 210 ASIA PACIFIC: OXIMETERS MARKET, BY TYPE, 2021–2028 (USD MILLION)
TABLE 211 ASIA PACIFIC: MARKET, BY END USER, 2021–2028 (USD MILLION)
10.4.2 JAPAN
10.4.2.1 Changing reimbursement scenario and increasing demand for cloud-connected sleep apnea therapeutic devices to aid market
TABLE 212 JAPAN: SLEEP APNEA DEVICES MARKET FORECAST, BY TYPE, 2021–2028 (USD MILLION)
TABLE 213 JAPAN: SLEEP APNEA DIAGNOSTIC DEVICES MARKET FOR THERAPEUTIC DEVICES, BY PRODUCT, 2021–2028 (USD MILLION)
TABLE 214 JAPAN: PAP DEVICES MARKET, BY TYPE, 2021–2028 (USD MILLION)
TABLE 215 JAPAN: FACIAL INTERFACES MARKET, BY TYPE, 2021–2028 (USD MILLION)
TABLE 216 JAPAN: MASKS MARKET, BY TYPE, 2021–2028 (USD MILLION)
TABLE 217 JAPAN: ACCESSORIES MARKET, BY TYPE, 2021–2028 (USD MILLION)
TABLE 218 JAPAN: ORAL APPLIANCES MARKET, BY TYPE, 2021–2028 (USD MILLION)
TABLE 219 JAPAN: MARKET FOR DIAGNOSTIC DEVICES, BY PRODUCT, 2021–2028 (USD MILLION)
TABLE 220 JAPAN: PSG DEVICES MARKET, BY TYPE, 2021–2028 (USD MILLION)
TABLE 221 JAPAN: OXIMETERS MARKET, BY TYPE, 2021–2028 (USD MILLION)
TABLE 222 JAPAN: MARKET REPORT, BY END USER, 2021–2028 (USD MILLION)
10.4.3 CHINA
10.4.3.1 Growing adult obesity rates and expanding geriatric population to propel market
TABLE 223 CHINA: SLEEP APNEA DEVICES MARKET FORECAST, BY TYPE, 2021–2028 (USD MILLION)
TABLE 224 CHINA: SLEEP APNEA DIAGNOSTIC DEVICES MARKET FOR THERAPEUTIC DEVICES, BY PRODUCT, 2021–2028 (USD MILLION)
TABLE 225 CHINA: PAP DEVICES MARKET, BY TYPE, 2021–2028 (USD MILLION)
TABLE 226 CHINA: FACIAL INTERFACES MARKET, BY TYPE, 2021–2028 (USD MILLION)
TABLE 227 CHINA: MASKS MARKET, BY TYPE, 2021–2028 (USD MILLION)
TABLE 228 CHINA: ACCESSORIES MARKET, BY TYPE, 2021–2028 (USD MILLION)
TABLE 229 CHINA: ORAL APPLIANCES MARKET, BY TYPE, 2021–2028 (USD MILLION)
TABLE 230 CHINA: MARKET DEMAND FOR DIAGNOSTIC DEVICES, BY PRODUCT, 2021–2028 (USD MILLION)
TABLE 231 CHINA: PSG DEVICES MARKET, BY TYPE, 2021–2028 (USD MILLION)
TABLE 232 CHINA: OXIMETERS MARKET, BY TYPE, 2021–2028 (USD MILLION)
TABLE 233 CHINA: SLEEP APNEA DEVICES INDUSTRY, BY END USER, 2021–2028 (USD MILLION)
10.4.4 AUSTRALIA
10.4.4.1 High prevalence of sleep apnea and increased number of awareness programs to drive market
TABLE 234 AUSTRALIA: SLEEP APNEA DEVICES MARKET TRENDS, BY TYPE, 2021–2028 (USD MILLION)
TABLE 235 AUSTRALIA: SLEEP APNEA DIAGNOSTIC DEVICES MARKET FOR THERAPEUTIC DEVICES, BY PRODUCT, 2021–2028 (USD MILLION)
TABLE 236 AUSTRALIA: PAP DEVICES MARKET, BY TYPE, 2021–2028 (USD MILLION)
TABLE 237 AUSTRALIA: FACIAL INTERFACES MARKET, BY TYPE, 2021–2028 (USD MILLION)
TABLE 238 AUSTRALIA: MASKS MARKET, BY TYPE, 2021–2028 (USD MILLION)
TABLE 239 AUSTRALIA: ACCESSORIES MARKET, BY TYPE, 2021–2028 (USD MILLION)
TABLE 240 AUSTRALIA: ORAL APPLIANCES MARKET, BY TYPE, 2021–2028 (USD MILLION)
TABLE 241 AUSTRALIA: MARKET FOR DIAGNOSTIC DEVICES, BY PRODUCT, 2021–2028 (USD MILLION)
TABLE 242 AUSTRALIA: PSG DEVICES MARKET, BY TYPE, 2021–2028 (USD MILLION)
TABLE 243 AUSTRALIA: OXIMETERS MARKET, BY TYPE, 2021–2028 (USD MILLION)
TABLE 244 AUSTRALIA: MARKET DEMAND, BY END USER, 2021–2028 (USD MILLION)
10.4.5 REST OF ASIA PACIFIC
TABLE 245 REST OF ASIA PACIFIC: SLEEP APNEA DEVICES MARKET TRENDS, BY TYPE, 2021–2028 (USD MILLION)
TABLE 246 REST OF ASIA PACIFIC: SLEEP APNEA DIAGNOSTIC DEVICES MARKET FOR THERAPEUTIC DEVICES, BY PRODUCT, 2021–2028 (USD MILLION)
TABLE 247 REST OF ASIA PACIFIC: PAP DEVICES MARKET, BY TYPE, 2021–2028 (USD MILLION)
TABLE 248 REST OF ASIA PACIFIC: FACIAL INTERFACES MARKET, BY TYPE, 2021–2028 (USD MILLION)
TABLE 249 REST OF ASIA PACIFIC: MASKS MARKET, BY TYPE, 2021–2028 (USD MILLION)
TABLE 250 REST OF ASIA PACIFIC: ACCESSORIES MARKET, BY TYPE, 2021–2028 (USD MILLION)
TABLE 251 REST OF ASIA PACIFIC: ORAL APPLIANCES MARKET, BY TYPE, 2021–2028 (USD MILLION)
TABLE 252 REST OF ASIA PACIFIC: MARKET FOR DIAGNOSTIC DEVICES, BY PRODUCT, 2021–2028 (USD MILLION)
TABLE 253 REST OF ASIA PACIFIC: PSG DEVICES MARKET, BY TYPE, 2021–2028 (USD MILLION)
TABLE 254 REST OF ASIA PACIFIC: OXIMETERS MARKET, BY TYPE, 2021–2028 (USD MILLION)
TABLE 255 REST OF ASIA PACIFIC: SLEEP APNEA DEVICES MARKET DEMAND, BY END USER, 2021–2028 (USD MILLION)
10.5 REST OF THE WORLD
TABLE 256 REST OF THE WORLD: SLEEP APNEA DEVICES MARKET TRENDS, BY REGION, 2021–2028 (USD MILLION)
TABLE 257 REST OF THE WORLD: SLEEP APNEA DIAGNOSTIC DEVICES MARKET, BY TYPE, 2021–2028 (USD MILLION)
TABLE 258 REST OF THE WORLD: MARKET DEMAND FOR THERAPEUTIC DEVICES, BY PRODUCT, 2021–2028 (USD MILLION)
TABLE 259 REST OF THE WORLD: PAP DEVICES MARKET, BY TYPE, 2021–2028 (USD MILLION)
TABLE 260 REST OF THE WORLD: FACIAL INTERFACES MARKET, BY TYPE, 2021–2028 (USD MILLION)
TABLE 261 REST OF THE WORLD: MASKS MARKET, BY TYPE, 2021–2028 (USD MILLION)
TABLE 262 REST OF THE WORLD: ACCESSORIES MARKET, BY TYPE, 2021–2028 (USD MILLION)
TABLE 263 REST OF THE WORLD: ORAL APPLIANCES MARKET, BY TYPE, 2021–2028 (USD MILLION)
TABLE 264 REST OF THE WORLD: SLEEP APNEA DIAGNOSTIC DEVICES MARKET, BY PRODUCT, 2021–2028 (USD MILLION)
TABLE 265 REST OF THE WORLD: PSG DEVICES MARKET, BY TYPE, 2021–2028 (USD MILLION)
TABLE 266 REST OF THE WORLD: OXIMETERS MARKET, BY TYPE, 2021–2028 (USD MILLION)
TABLE 267 REST OF THE WORLD: SLEEP APNEA DEVICES INDUSTRY, BY END USER, 2021–2028 (USD MILLION)
10.5.1 LATIN AMERICA
10.5.1.1 Increasing obesity rate to augment prevalence of sleep apnea
10.5.1.2 Latin America: Impact of economic recession
TABLE 268 LATIN AMERICA: SLEEP APNEA DEVICES MARKET TRENDS, BY TYPE, 2021–2028 (USD MILLION)
TABLE 269 LATIN AMERICA: SLEEP APNEA DIAGNOSTIC DEVICES MARKET FOR THERAPEUTIC DEVICES, BY PRODUCT, 2021–2028 (USD MILLION)
TABLE 270 LATIN AMERICA: PAP DEVICES MARKET, BY TYPE, 2021–2028 (USD MILLION)
TABLE 271 LATIN AMERICA: FACIAL INTERFACES MARKET, BY TYPE, 2021–2028 (USD MILLION)
TABLE 272 LATIN AMERICA: MASKS MARKET, BY TYPE, 2021–2028 (USD MILLION)
TABLE 273 LATIN AMERICA: ACCESSORIES MARKET, BY TYPE, 2021–2028 (USD MILLION)
TABLE 274 LATIN AMERICA: ORAL APPLIANCES MARKET, BY TYPE, 2021–2028 (USD MILLION)
TABLE 275 LATIN AMERICA: SLEEP APNEA DIAGNOSTIC DEVICES MARKET, BY PRODUCT, 2021–2028 (USD MILLION)
TABLE 276 LATIN AMERICA: PSG DEVICES MARKET, BY TYPE, 2021–2028 (USD MILLION)
TABLE 277 LATIN AMERICA: OXIMETERS MARKET, BY TYPE, 2021–2028 (USD MILLION)
TABLE 278 LATIN AMERICA: SLEEP APNEA DEVICES MARKET DEMAND, BY END USER, 2021–2028 (USD MILLION)
10.5.2 MIDDLE EAST & AFRICA
10.5.2.1 Dearth of awareness about sleep apnea among general population to limit market
10.5.2.2 Middle East & Africa: Impact of economic recession
TABLE 279 MIDDLE EAST & AFRICA: SLEEP APNEA DEVICES MARKET TRENDS, BY TYPE, 2021–2028 (USD MILLION)
TABLE 280 MIDDLE EAST & AFRICA: SLEEP APNEA DIAGNOSTIC DEVICES MARKET FOR THERAPEUTIC DEVICES, BY PRODUCT, 2021–2028 (USD MILLION)
TABLE 281 MIDDLE EAST & AFRICA: PAP DEVICES MARKET, BY TYPE, 2021–2028 (USD MILLION)
TABLE 282 MIDDLE EAST & AFRICA: FACIAL INTERFACES MARKET, BY TYPE, 2021–2028 (USD MILLION)
TABLE 283 MIDDLE EAST & AFRICA: MASKS MARKET, BY TYPE, 2021–2028 (USD MILLION)
TABLE 284 MIDDLE EAST & AFRICA: ACCESSORIES MARKET, BY TYPE, 2021–2028 (USD MILLION)
TABLE 285 MIDDLE EAST & AFRICA: ORAL APPLIANCES MARKET, BY TYPE, 2021–2028 (USD MILLION)
TABLE 286 MIDDLE EAST & AFRICA: MARKET FOR DIAGNOSTIC DEVICES, BY PRODUCT, 2021–2028 (USD MILLION)
TABLE 287 MIDDLE EAST & AFRICA: PSG DEVICES MARKET, BY TYPE, 2021–2028 (USD MILLION)
TABLE 288 MIDDLE EAST & AFRICA: OXIMETERS MARKET, BY TYPE, 2021–2028 (USD MILLION)
TABLE 289 MIDDLE EAST & AFRICA: SLEEP APNEA DEVICES MARKET ANALYSIS, BY END USER, 2021–2028 (USD MILLION)
11 COMPETITIVE LANDSCAPE (Page No. - 234)
11.1 OVERVIEW
11.2 KEY STRATEGIES ADOPTED BY MAJOR PLAYERS IN SLEEP APNEA DEVICES MARKET
TABLE 290 OVERVIEW OF STRATEGIES ADOPTED BY KEY SLEEP APNEA DEVICE MANUFACTURERS
11.3 REVENUE ANALYSIS
FIGURE 32 REVENUE ANALYSIS OF KEY PLAYERS
11.4 MARKET SHARE ANALYSIS
TABLE 291 SLEEP APNEA DEVICES INDUSTRY: DEGREE OF COMPETITION
FIGURE 33 MARKET SHARE ANALYSIS, 2022
11.5 COMPANY EVALUATION MATRIX
11.5.1 STARS
11.5.2 EMERGING LEADERS
11.5.3 PERVASIVE PLAYERS
11.5.4 PARTICIPANTS
FIGURE 34 SLEEP APNEA DIAGNOSTIC DEVICES MARKET: COMPANY EVALUATION QUADRANT
11.6 COMPANY EVALUATION QUADRANT (SMES/START-UPS)
11.6.1 PROGRESSIVE SLEEP APNEA COMPANIES
11.6.2 STARTING BLOCKS
11.6.3 RESPONSIVE SLEEP APNEA COMPANIES
11.6.4 DYNAMIC SLEEP APNEA COMPANIES
FIGURE 35 SLEEP APNEA DIAGNOSTIC DEVICES MARKET: COMPANY EVALUATION QUADRANT FOR START-UPS/SMES
11.7 COMPANY FOOTPRINT ANALYSIS
TABLE 292 COMPANY FOOTPRINT OF PLAYERS IN MARKET
TABLE 293 COMPANY PRODUCT FOOTPRINT
TABLE 294 COMPANY REGIONAL FOOTPRINT
11.8 COMPETITIVE BENCHMARKING
TABLE 295 SLEEP APNEA DEVICES INDUSTRY: DETAILED LIST OF KEY START-UPS/SMES
11.9 COMPETITIVE SCENARIO
11.9.1 KEY PRODUCT LAUNCHES AND APPROVALS
TABLE 296 SLEEP APNEA DIAGNOSTIC DEVICES MARKET: KEY PRODUCT LAUNCHES AND APPROVALS, 2020–2023
11.9.2 KEY DEALS
TABLE 297 SLEEP APNEA DIAGNOSTIC DEVICES MARKET: KEY DEALS, 2020–2023
11.9.3 OTHER KEY DEVELOPMENTS
TABLE 298 SLEEP APNEA DEVICES INDUSTRY: OTHER KEY DEVELOPMENTS, 2020–2023
12 COMPANY PROFILES (Page No. - 248)
12.1 KEY PLAYERS
(Business Overview, Products/Services/Solutions Offered, MnM View, Key Strengths and Right to Win, Strategic Choices Made, Weaknesses and Competitive Threats, Recent Developments)*
12.1.1 RESMED
TABLE 299 RESMED: COMPANY OVERVIEW
FIGURE 36 RESMED: COMPANY SNAPSHOT (2022)
12.1.2 KONINKLIJKE PHILIPS N.V.
TABLE 300 KONINKLIJKE PHILIPS N.V.: COMPANY OVERVIEW
FIGURE 37 KONINKLIJKE PHILIPS N.V.: COMPANY SNAPSHOT (2022)
12.1.3 FISHER & PAYKEL HEALTHCARE LIMITED
TABLE 301 FISHER & PAYKEL HEALTHCARE LIMITED: COMPANY OVERVIEW
FIGURE 38 FISHER & PAYKEL HEALTHCARE LIMITED: COMPANY SNAPSHOT (2022)
12.1.4 INSPIRE MEDICAL SYSTEMS, INC.
TABLE 302 INSPIRE MEDICAL SYSTEMS, INC.: COMPANY OVERVIEW
FIGURE 39 INSPIRE MEDICAL SYSTEMS, INC.: COMPANY SNAPSHOT (2022)
12.1.5 SOMNOMED
TABLE 303 SOMNOMED: COMPANY OVERVIEW
FIGURE 40 SOMNOMED: COMPANY SNAPSHOT (2022)
12.1.6 OVENTUS MEDICAL
TABLE 304 OVENTUS MEDICAL: COMPANY OVERVIEW
FIGURE 41 OVENTUS MEDICAL: COMPANY SNAPSHOT (2022)
12.1.7 COMPUMEDICS LIMITED
TABLE 305 COMPUMEDICS LIMITED: COMPANY OVERVIEW
FIGURE 42 COMPUMEDICS LIMITED: COMPANY SNAPSHOT (2022)
12.1.8 LOWENSTEIN MEDICAL TECHNOLOGY GMBH + CO. KG.
TABLE 306 LOWENSTEIN MEDICAL TECHNOLOGY GMBH + CO. KG.: COMPANY OVERVIEW
12.1.9 DRIVE DEVILBISS HEALTHCARE
TABLE 307 DRIVE DEVILBISS HEALTHCARE: COMPANY OVERVIEW
12.1.10 BMC MEDICAL CO., LTD.
TABLE 308 BMC MEDICAL CO., LTD.: COMPANY OVERVIEW
12.1.11 BRAEBON MEDICAL CORPORATION
TABLE 309 BRAEBON MEDICAL CORPORATION: COMPANY OVERVIEW
12.1.12 WHOLE YOU, INC.
TABLE 310 WHOLE YOU, INC.: COMPANY OVERVIEW
12.1.13 PANTHERA DENTAL
TABLE 311 PANTHERA DENTAL: COMPANY OVERVIEW
12.1.14 MYERSON LLC
TABLE 312 MYERSON LLC: COMPANY OVERVIEW
12.1.15 PROSOMNUS SLEEP TECHNOLOGIES
TABLE 313 PROSOMNUS SLEEP TECHNOLOGIES: COMPANY OVERVIEW
FIGURE 43 PROSOMNUS SLEEP TECHNOLOGIES: COMPANY SNAPSHOT (2022)
12.2 OTHER PLAYERS
12.2.1 NIDEK MEDICAL INDIA
12.2.2 TOMED GMBH
12.2.3 LIVANOVA
12.2.4 INVACARE CORPORATION
12.2.5 MPOWRX HEALTH & WELLNESS
12.2.6 NIHON KOHDEN
12.2.7 NATUS MEDICAL INCORPORATED
12.2.8 VIVOS THERAPEUTICS
12.2.9 AIRWAY MANAGEMENT
12.2.10 APNEA SCIENCES
*Business Overview, Products/Services/Solutions Offered, MnM View, Key Strengths and Right to Win, Strategic Choices Made, Weaknesses and Competitive Threats, Recent Developments might not be captured in case of unlisted sleep apnea companies.
13 APPENDIX (Page No. - 293)
13.1 DISCUSSION GUIDE
13.2 KNOWLEDGESTORE: MARKETSANDMARKETS’ SUBSCRIPTION PORTAL
13.3 CUSTOMIZATION OPTIONS
13.4 RELATED REPORTS
13.5 AUTHOR DETAILS


 Generating Response ...


Growth opportunities and latent adjacency in Sleep Apnea Devices Market
Which of the end user segment is supposed to hold the major share of the global Sleep Apnea Devices Market?
Which factors are responsible for boosting the global growth of Sleep Apnea Devices Market?