

Real Assets
Does Gold’s Value Increase During Recessions?
Does Gold’s Value Increase During Recessions?
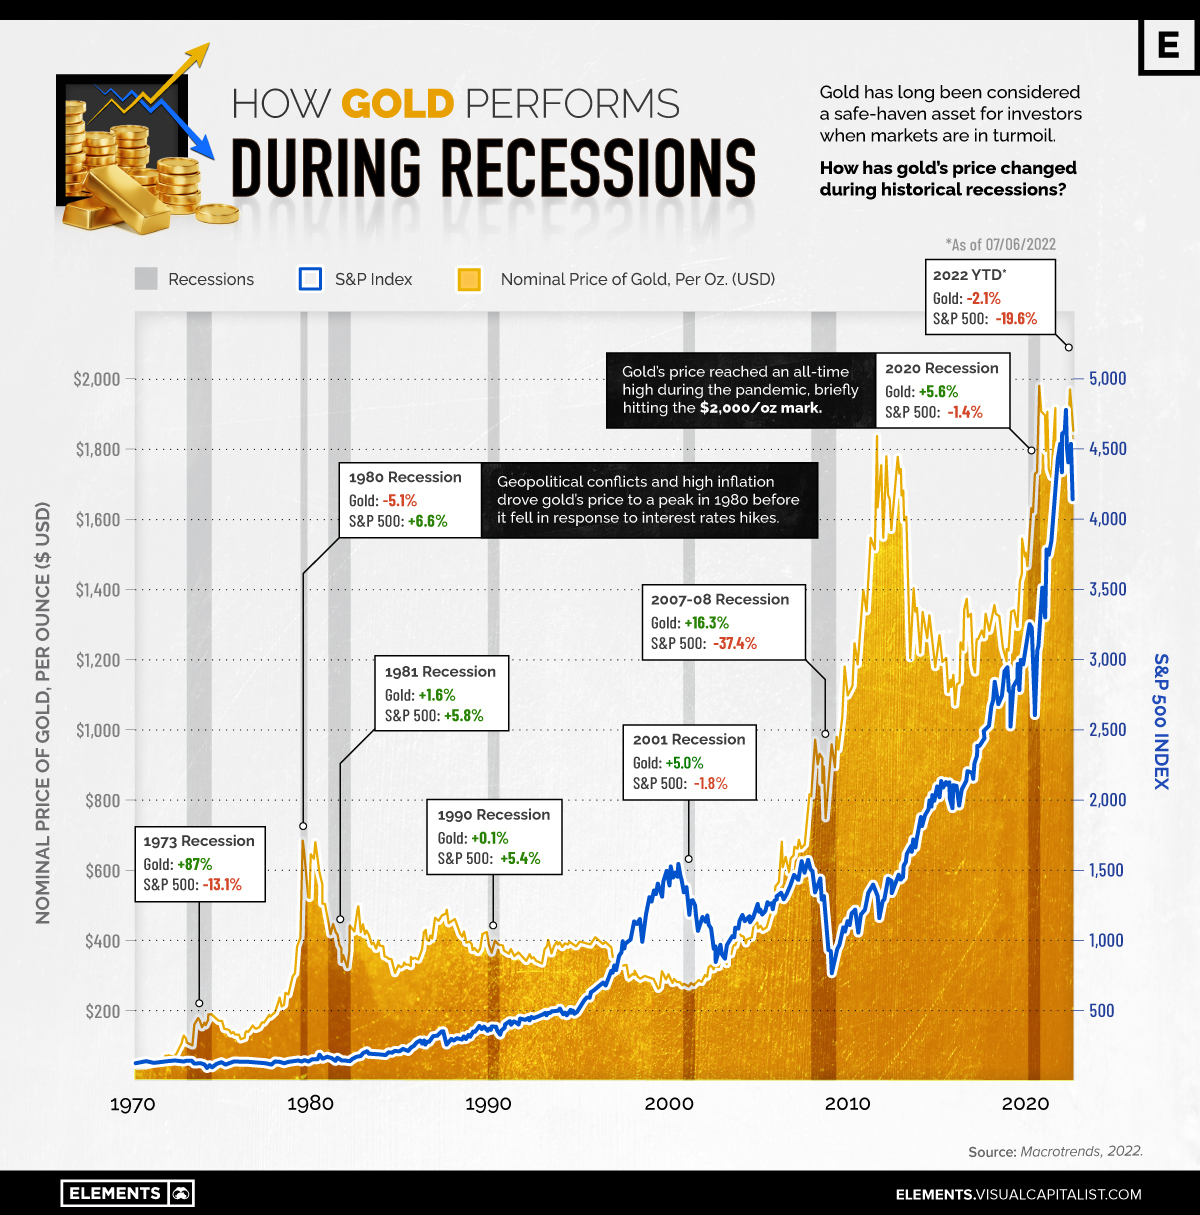
Gold has been traditionally considered a safe-haven asset, with many investors turning to the yellow metal during recessions and times of turmoil.
So, how does gold hold up when the economy tumbles?
The above graphic uses data from Macrotrends to highlight gold’s price movements during recessions and compares it to changes in the S&P 500.
Gold vs. the S&P 500 in Historical Recessions
Gold’s value comes from its scarcity as a precious metal, in addition to its long history as a stable medium of exchange.
Gold also has a low-to-negative correlation with the stock market, suggesting that changes in the price of gold are largely independent of how stocks are faring. As a result, gold is considered an effective diversification tool for investors who want to hedge their bets.
But has gold helped investors weather recessionary storms in the past?
| Recession year | Recession length | % change in nominal price of gold | % change in S&P 500 |
|---|---|---|---|
| 1973 | 16 months | 87% | -13.1% |
| 1980 | 6 months | -5.1% | 6.6% |
| 1981 | 16 months | 1.6% | 5.8% |
| 1990 | 8 months | 0.1% | 5.4% |
| 2001 | 8 months | 5.0% | -1.8% |
| 2007 | 18 months | 16.3% | -37.4% |
| 2020 | 2 months | 5.6% | -1.4% |
Since 1971, when the gold standard was abandoned, gold has largely seen positive price changes during recessions. And in the last three recessions since 2000, its performance has countered that of the S&P 500. While the increases in value haven’t been dramatic, they help cement gold’s position as a hedge against financial turmoil and as a store of value.
For example, when the stock market collapsed in 2007, investment demand for gold increased as investors looked for a safer option. Between 2007 and 2011, gold’s price more than doubled. Similarly, with fear and uncertainty at a high during the COVID-19 pandemic, gold-backed exchange-traded funds saw record inflows, and the price of gold reached an all-time high.
However, while gold’s price tends to rise during times of economic turmoil, it often stagnates or falls when the economy is healthy and investors seek riskier investments. As a result, it’s important for investors to consider the overall macroeconomic and geopolitical environment when looking at gold.
Gold’s Time to Shine in 2022?
The global economy has been shaking with turbulence in 2022, with consumers facing high inflation and investors seeing dismal stock market returns.
While these market conditions typically point towards rising demand for gold, that hasn’t been the case so far this year, with prices down 2% year-to-date. This is partly because of rising interest rates, which increase the opportunity cost of holding gold as investors forgo the interest income they could earn from saving accounts or bonds.
But in fact, history shows that gold often outperforms U.S. stocks and the dollar following interest rate hikes, after underperforming in the lead-up to rate hikes. Additionally, high inflation is eroding the purchasing power of each dollar, incentivizing investment in a tangible asset like gold and other hard assets.
With geopolitical uncertainty at a high and the U.S. consumer sentiment at decade-lows, will gold prove its value as a safe-haven asset in 2022?


Real Assets
Visualizing Global Gold Production in 2023
Gold production in 2023 was led by China, Australia, and Russia, with each outputting over 300 tonnes.
Visualizing Global Gold Production in 2023
This was originally posted on our Voronoi app. Download the app for free on iOS or Android and discover incredible data-driven charts from a variety of trusted sources.
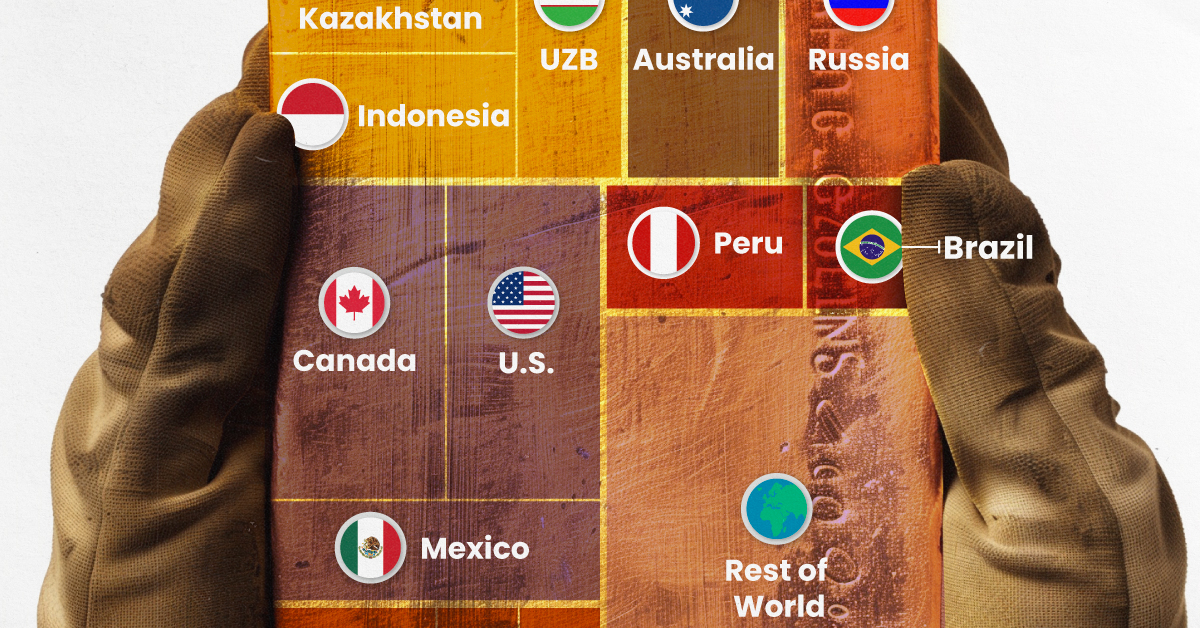
Over 3,000 tonnes of gold were produced globally in 2023.
In this graphic, we list the world’s leading countries in terms of gold production. These figures come from the latest USGS publication on gold statistics (published January 2024).
China, Australia, and Russia Produced the Most Gold in 2023
China was the top producer in 2023, responsible for over 12% of total global production, followed by Australia and Russia.
| Country | Region | 2023E Production (tonnes) |
|---|---|---|
| 🇨🇳 China | Asia | 370 |
| 🇦🇺 Australia | Oceania | 310 |
| 🇷🇺 Russia | Europe | 310 |
| 🇨🇦 Canada | North America | 200 |
| 🇺🇸 United States | North America | 170 |
| 🇰🇿 Kazakhstan | Asia | 130 |
| 🇲🇽 Mexico | North America | 120 |
| 🇮🇩 Indonesia | Asia | 110 |
| 🇿🇦 South Africa | Africa | 100 |
| 🇺🇿 Uzbekistan | Asia | 100 |
| 🇬🇭 Ghana | Africa | 90 |
| 🇵🇪 Peru | South America | 90 |
| 🇧🇷 Brazil | South America | 60 |
| 🇧🇫 Burkina Faso | Africa | 60 |
| 🇲🇱 Mali | Africa | 60 |
| 🇹🇿 Tanzania | Africa | 60 |
| 🌍 Rest of World | - | 700 |
Gold mines in China are primarily concentrated in eastern provinces such as Shandong, Henan, Fujian, and Liaoning. As of January 2024, China’s gold mine reserves stand at an estimated 3,000 tonnes, representing around 5% of the global total of 59,000 tonnes.
In addition to being the top producer, China emerged as the largest buyer of the yellow metal for the year. In fact, the country’s central bank alone bought 225 tonnes of gold in 2023, according the World Gold Council.
Estimated Global Gold Consumption
Most of the gold produced in 2023 was used in jewelry production, while another significant portion was sold as a store of value, such as in gold bars or coins.
- Jewelry: 46%
- Central Banks and Institutions: 23%
- Physical Bars: 16%
- Official Coins, Medals, and Imitation Coins: 9%
- Electrical and Electronics: 5%
- Other: 1%
According to Fitch Solutions, over the medium term (2023-2032), global gold mine production is expected to grow 15%, as high prices encourage investment and output.
Real Assets
Charted: The Value Gap Between the Gold Price and Gold Miners
While gold prices hit all-time highs, gold mining stocks have lagged far behind.

Gold Price vs. Gold Mining Stocks
This was originally posted on our Voronoi app. Download the app for free on Apple or Android and discover incredible data-driven charts from a variety of trusted sources.
Although the price of gold has reached new record highs in 2024, gold miners are still far from their 2011 peaks.
In this graphic, we illustrate the evolution of gold prices since 2000 compared to the NYSE Arca Gold BUGS Index (HUI), which consists of the largest and most widely held public gold production companies. The data was compiled by Incrementum AG.
Mining Stocks Lag Far Behind
In April 2024, gold reached a new record high as Federal Reserve Chair Jerome Powell signaled policymakers may delay interest rate cuts until clearer signs of declining inflation materialize.
Additionally, with elections occurring in more than 60 countries in 2024 and ongoing conflicts in Ukraine and Gaza, central banks are continuing to buy gold to strengthen their reserves, creating momentum for the metal.
Traditionally known as a hedge against inflation and a safe haven during times of political and economic uncertainty, gold has climbed over 11% so far this year.
According to Business Insider, gold miners experienced their best performance in a year in March 2024. During that month, the gold mining sector outperformed all other U.S. industries, surpassing even the performance of semiconductor stocks.
Still, physical gold has outperformed shares of gold-mining companies over the past three years by one of the largest margins in decades.
| Year | Gold Price | NYSE Arca Gold BUGS Index (HUI) |
|---|---|---|
| 2023 | $2,062.92 | $243.31 |
| 2022 | $1,824.32 | $229.75 |
| 2021 | $1,828.60 | $258.87 |
| 2020 | $1,895.10 | $299.64 |
| 2019 | $1,523.00 | $241.94 |
| 2018 | $1,281.65 | $160.58 |
| 2017 | $1,296.50 | $192.31 |
| 2016 | $1,151.70 | $182.31 |
| 2015 | $1,060.20 | $111.18 |
| 2014 | $1,199.25 | $164.03 |
| 2013 | $1,201.50 | $197.70 |
| 2012 | $1,664.00 | $444.22 |
| 2011 | $1,574.50 | $498.73 |
| 2010 | $1,410.25 | $573.32 |
| 2009 | $1,104.00 | $429.91 |
| 2008 | $865.00 | $302.41 |
| 2007 | $836.50 | $409.37 |
| 2006 | $635.70 | $338.24 |
| 2005 | $513.00 | $276.90 |
| 2004 | $438.00 | $215.33 |
| 2003 | $417.25 | $242.93 |
| 2002 | $342.75 | $145.12 |
| 2001 | $276.50 | $65.20 |
| 2000 | $272.65 | $40.97 |
Among the largest companies on the NYSE Arca Gold BUGS Index, Colorado-based Newmont has experienced a 24% drop in its share price over the past year. Similarly, Canadian Barrick Gold also saw a decline of 6.5% over the past 12 months.

-

 Electrification3 years ago
Ranked: The Top 10 EV Battery Manufacturers
-

 Electrification2 years ago
The Key Minerals in an EV Battery
-

 Real Assets3 years ago
The World’s Top 10 Gold Mining Companies
-

 Misc3 years ago
All the Metals We Mined in One Visualization
-

 Energy Shift2 years ago
What Are the Five Major Types of Renewable Energy?
-

 Electrification2 years ago
Mapped: Solar Power by Country in 2021
-

 Electrification2 years ago
The World’s Largest Nickel Mining Companies
-

 Electrification3 years ago
How Much Land is Needed to Power the U.S. with Solar?